Western Union 2009 Annual Report Download - page 60
Download and view the complete annual report
Please find page 60 of the 2009 Western Union annual report below. You can navigate through the pages in the report by either clicking on the pages listed below, or by using the keyword search tool below to find specific information within the annual report.-
 1
1 -
2
-
3
-
4
-
5
-
6
-
7
-
8
-
9
-
10
-
11
-
12
-
13
-
14
-
15
-
16
-
17
-
18
-
19
-
20
-
21
-
22
-
23
-
24
-
25
-
26
-
27
-
28
-
29
-
30
-
31
-
32
-
33
-
34
-
35
-
36
-
37
-
38
-
39
-
40
-
41
-
42
-
43
-
44
-
45
-
46
-
47
-
48
-
49
-
 50
50 -
 51
51 -
 52
52 -
 53
53 -
 54
54 -
 55
55 -
 56
56 -
 57
57 -
 58
58 -
 59
59 -
 60
60 -
 61
61 -
 62
62 -
 63
63 -
 64
64 -
 65
65 -
 66
66 -
 67
67 -
 68
68 -
 69
69 -
 70
70 -
71
-
72
-
73
-
74
-
75
-
76
-
77
-
78
-
79
-
80
-
81
-
82
-
83
-
84
-
85
-
86
-
87
-
88
-
89
-
90
-
91
-
92
-
93
-
94
-
95
-
96
-
97
-
98
-
99
-
100
-
101
-
102
-
103
-
104
-
105
-
106
-
107
-
108
-
109
-
110
-
111
-
112
-
113
-
114
-
115
-
116
-
117
-
118
-
119
-
120
-
121
-
122
-
123
-
124
-
125
-
126
-
127
-
128
-
129
-
130
-
131
-
132
-
133
-
134
-
135
-
136
-
137
-
138
-
139
-
140
-
141
-
142
-
143
-
144
-
145
-
146
-
147
-
148
-
149
-
150
-
151
-
152
-
153
 |
 |
multi-state not-for-profit organization promoting safety and security along the United States and Mexico
border, in which California, Texas and New Mexico will participate with Arizona. The accrual includes
amounts for reimbursement to the State of Arizona for its costs associated with this matter. In addition, as part
of the agreement and settlement, we expect to make certain investments in our compliance programs along the
United States and Mexico border and to engage a monitor of that program, which are expected to cost up to
$23 million over the next two to four years.
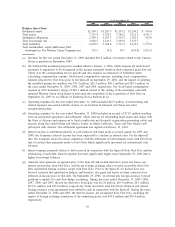
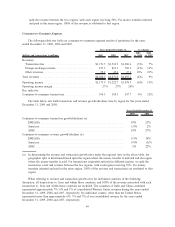
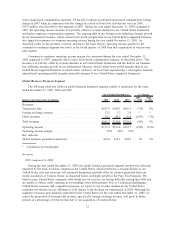
SG&A expenses increased for the year ended December 31, 2008 compared to the same period in the
prior year due to higher employee compensation expenses and restructuring and related expenses of
$20.1 million, offset by better leveraging of our marketing expenses as well as lower stock compensation
charges in 2008, as described above.
During the years ended December 31, 2009, 2008 and 2007, marketing related expenditures, principally
classified within SG&A, were approximately 5% to 6% of revenue. Marketing related expenditures include
advertising, events, loyalty programs and the cost of employees dedicated to marketing activities. When
making decisions with respect to marketing investments, we review opportunities for advertising and other
marketing related expenditures together with opportunities for fee adjustments, as discussed in “Segment
Discussion,” for consumer-to-consumer revenues and other initiatives in order to best maximize the return on
these investments.
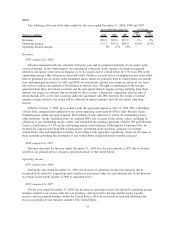
Interest income
Interest income decreased during both the year ended December 31, 2009 compared to 2008 and the year
ended December 31, 2008 compared to 2007 primarily due to lower short-term interest rates and lower
average interest-bearing cash balances.
Interest expense
Interest expense decreased for both the year ended December 31, 2009 compared to 2008 and the year
ended December 31, 2008 compared to 2007 due to lower short-term interest rates on certain debt with
floating interest rates. In addition, lower average borrowing balances impacted the decline in interest expense
for the year ended December 31, 2009 compared to the previous year.
Derivative (losses)/gains, net
Changes in derivative (losses)/gains, net were immaterial for the year ended December 31, 2009
compared to the prior year. Volatility in foreign currency forward rates compared to spot rates, primarily
related to the euro, resulted in the decrease to income for the year ended December 31, 2008 compared to
2007.
Other income, net
Other income, net decreased during the year ended December 31, 2009 compared to 2008 due to a
$12 million reserve taken against our receivable from the Reserve International Liquidity Fund, Ltd. and a
decline in earnings on our equity method investments in 2009, primarily as a result of the absence of equity
method earnings for FEXCO subsequent to the acquisition date. Changes in other income, net during the year
ended December 31, 2008 compared to the previous corresponding year was primarily attributable to
fluctuations in equity earnings from equity method investments.
Income taxes
Our effective tax rates on pretax income were 25.0%, 25.8% and 29.9% for the years ended
December 31, 2009, 2008 and 2007, respectively. We continue to benefit from an increasing proportion of
profits being foreign-derived and therefore taxed at lower rates than our combined federal and state tax rates
in the United States. In addition, during 2008, we implemented additional foreign tax efficient strategies
consistent with our overall tax planning which impacted our effective tax rate for all subsequent periods.
46