Western Union 2009 Annual Report Download - page 69
Download and view the complete annual report
Please find page 69 of the 2009 Western Union annual report below. You can navigate through the pages in the report by either clicking on the pages listed below, or by using the keyword search tool below to find specific information within the annual report.-
 1
1 -
2
-
3
-
4
-
5
-
6
-
7
-
8
-
9
-
10
-
11
-
12
-
13
-
14
-
15
-
16
-
17
-
18
-
19
-
20
-
21
-
22
-
23
-
24
-
25
-
26
-
27
-
28
-
29
-
30
-
31
-
32
-
33
-
34
-
35
-
36
-
37
-
38
-
39
-
40
-
41
-
42
-
43
-
44
-
45
-
46
-
47
-
48
-
49
-
50
-
51
-
52
-
53
-
54
-
55
-
56
-
57
-
58
-
 59
59 -
 60
60 -
 61
61 -
 62
62 -
 63
63 -
 64
64 -
 65
65 -
 66
66 -
 67
67 -
 68
68 -
 69
69 -
 70
70 -
 71
71 -
 72
72 -
 73
73 -
 74
74 -
 75
75 -
 76
76 -
 77
77 -
 78
78 -
 79
79 -
80
-
81
-
82
-
83
-
84
-
85
-
86
-
87
-
88
-
89
-
90
-
91
-
92
-
93
-
94
-
95
-
96
-
97
-
98
-
99
-
100
-
101
-
102
-
103
-
104
-
105
-
106
-
107
-
108
-
109
-
110
-
111
-
112
-
113
-
114
-
115
-
116
-
117
-
118
-
119
-
120
-
121
-
122
-
123
-
124
-
125
-
126
-
127
-
128
-
129
-
130
-
131
-
132
-
133
-
134
-
135
-
136
-
137
-
138
-
139
-
140
-
141
-
142
-
143
-
144
-
145
-
146
-
147
-
148
-
149
-
150
-
151
-
152
-
153
 |
 |

Other
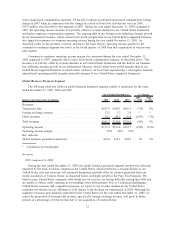
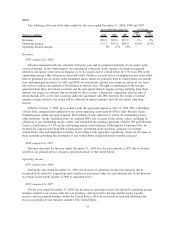
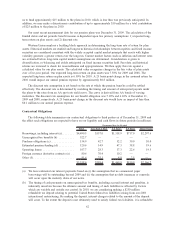
The following table sets forth other results for the years ended December 31, 2009, 2008 and 2007.
(dollars in millions) 2009 2008 2007
2009
vs. 2008
2008
vs. 2007
Years Ended December 31, % Change
Revenues ......................................... $91.2 $90.6 $87.2 1% 4%
Operating income................................... $ 6.3 $15.8 $20.0 (60)% (21)%
Operating income margin ............................. 7% 17% 23%
Revenues
2009 compared to 2008
Revenue remained relatively consistent with prior year and is comprised primarily of our money order
services business. In the fourth quarter, we experienced a decrease in the amount of revenue recognized
related to our money order services business as we no longer receive a fixed return of 5.5% from IPS on the
outstanding money order balances as described below. However, we now derive investment income from actual
interest generated on our money order settlement assets, which are primarily held in United States tax exempt
state and municipal securities. In 2008 and 2009, we entered into interest rate swaps on certain of our fixed
rate notes to reduce our exposure to fluctuations in interest rates. Through a combination of the revenue
generated from these investment securities and the anticipated interest expense savings resulting from these
interest rate swaps, we estimate that we should be able to retain, a materially comparable after-tax rate of
return through 2011 as we were receiving under the agreement with IPS. However, the results of interest
expense savings related to the swaps will be reflected in interest expense and will not impact operating
income.
Effective October 1, 2009, in accordance with the agreement signed on July 18, 2008, IPS, a subsidiary
of First Data, assigned and transferred to us certain operating assets used by IPS to issue Western Union
branded money orders and approximately $860 million of cash sufficient to satisfy all outstanding money
order liabilities. On the Transition Date, we assumed IPS’s role as issuer of the money orders, including its
obligation to pay outstanding money orders, and terminated the existing agreement whereby IPS paid Western
Union a fixed return of 5.5% on the outstanding money order balances. Following the Transition Date, we
invested the cash received from IPS in high-quality, investment grade securities, primarily tax exempt
United States state and municipal securities, in accordance with applicable regulations, which are the same as
those currently governing the investment of our United States originated money transfer principal.
2008 compared to 2007
Revenue increased for the year ended December 31, 2008 over the same period in 2007 due to revenue
growth in our prepaid services business generated outside of the United States.
Operating income
2009 compared to 2008
During the year ended December 31, 2009, the decrease in operating income was primarily due to
increased costs related to acquisitions and a decline in our money order services business due to the decrease
in revenue in the fourth quarter of 2009 as described above.
2008 compared to 2007
For the year ended December 31, 2008, the decrease in operating income was driven by operating income
declines related to our money order services business, costs incurred to develop mobile money transfer
services and our prepaid business within the United States, offset by increased revenue and related profits
from our prepaid services business outside of the United States.
55