Western Union 2009 Annual Report Download - page 62
Download and view the complete annual report
Please find page 62 of the 2009 Western Union annual report below. You can navigate through the pages in the report by either clicking on the pages listed below, or by using the keyword search tool below to find specific information within the annual report.
average shares outstanding. Earnings per share increased during the year ended December 31, 2008 compared
to 2007 due to the increased net income as a result of the previously described factors and lower weighted-
average diluted shares outstanding. The lower number of shares outstanding was driven by stock repurchases
exceeding stock option exercises in both 2009 and 2008 compared to the corresponding periods.
Segment Discussion
We manage our business around the consumers and businesses we serve and the types of services we
offer. Each of our two segments addresses a different combination of consumer groups, distribution networks
and services offered. Our segments are consumer-to-consumer and global business payments. Businesses not
considered part of these segments are categorized as “Other.”
The business segment measurements provided to, and evaluated by, our CODM are computed in
accordance with the following principles:
• The accounting policies of the reporting segments are the same as those described in the summary of
significant accounting policies.
• Corporate and other overhead is allocated to the segments primarily based on a percentage of the
segments’ revenue compared to total revenue.
• Expenses incurred in connection with mergers and acquisitions are included in “Other.”
• An accrual of $71.0 million for an anticipated agreement and settlement with the State of Arizona
recorded during the year ended December 31, 2009 has not been allocated to the segments. On
February 11, 2010, we signed this agreement and settlement, which resolved all outstanding legal
issues and claims with the State and requires us to fund a multi-state not-for-profit organization
promoting safety and security along the United States and Mexico border, in which California, Texas
and New Mexico will participate with Arizona. While this item was identifiable to our
consumer-to-consumer segment, it was not included in the measurement of segment operating profit
provided to the CODM for purposes of assessing segment performance and decision making with
respect to resource allocation. For additional information on the settlement accrual, refer to
“Operating expenses overview.”
• Restructuring and related activities of $82.9 million for the year ended December 31, 2008 have not
been allocated to the segments. While these items were identifiable to our segments, they were not
included in the measurement of segment operating profit provided to the CODM for purposes of
assessing segment performance and decision making with respect to resource allocation. For
additional information on restructuring and related activities refer to “Operating expenses overview.”
• All items not included in operating income are excluded.
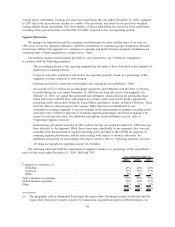
The following table sets forth the components of segment revenues as a percentage of the consolidated
totals for the years ended December 31, 2009, 2008 and 2007.
2009 2008 2007
Years Ended December 31,
Consumer-to-consumer (a)
EMEASA .................................................... 45% 44% 40%
Americas ..................................................... 32% 34% 37%
APAC....................................................... 8% 7% 6%
Total consumer-to-consumer ........................................ 85% 85% 83%
Global business payments .......................................... 14% 14% 15%
Other ......................................................... 1% 1% 2%
100% 100% 100%
(a) The geographic split is determined based upon the region where the money transfer is initiated and the
region where the money transfer is paid. For transactions originated and paid in different regions, we
48


