Western Union 2009 Annual Report Download - page 110
Download and view the complete annual report
Please find page 110 of the 2009 Western Union annual report below. You can navigate through the pages in the report by either clicking on the pages listed below, or by using the keyword search tool below to find specific information within the annual report.-
 1
1 -
2
-
3
-
4
-
5
-
6
-
7
-
8
-
9
-
10
-
11
-
12
-
13
-
14
-
15
-
16
-
17
-
18
-
19
-
20
-
21
-
22
-
23
-
24
-
25
-
26
-
27
-
28
-
29
-
30
-
31
-
32
-
33
-
34
-
35
-
36
-
37
-
38
-
39
-
40
-
41
-
42
-
43
-
44
-
45
-
46
-
47
-
48
-
49
-
50
-
51
-
52
-
53
-
54
-
55
-
56
-
57
-
58
-
59
-
60
-
61
-
62
-
63
-
64
-
65
-
66
-
67
-
68
-
69
-
70
-
71
-
72
-
73
-
74
-
75
-
76
-
77
-
78
-
79
-
80
-
81
-
82
-
83
-
84
-
85
-
86
-
87
-
88
-
89
-
90
-
91
-
92
-
93
-
94
-
95
-
96
-
97
-
98
-
99
-
 100
100 -
 101
101 -
 102
102 -
 103
103 -
 104
104 -
 105
105 -
 106
106 -
 107
107 -
 108
108 -
 109
109 -
 110
110 -
 111
111 -
 112
112 -
 113
113 -
 114
114 -
 115
115 -
 116
116 -
 117
117 -
 118
118 -
 119
119 -
 120
120 -
121
-
122
-
123
-
124
-
125
-
126
-
127
-
128
-
129
-
130
-
131
-
132
-
133
-
134
-
135
-
136
-
137
-
138
-
139
-
140
-
141
-
142
-
143
-
144
-
145
-
146
-
147
-
148
-
149
-
150
-
151
-
152
-
153
 |
 |

no longer provides to IPS the services required under the original money order agreement or receives from
IPS the fee for such services.
In 2008, the Company began increasing its investment levels in various state and municipal variable rate
demand note securities which can be put (sold at par) typically on a daily basis with settlement periods
ranging from the same day to one week, but that have varying maturities through 2048. Generally, these
securities are used by the Company for short-term liquidity needs and are held for short periods of time,
typically less than 30 days. As a result, this has increased the frequency of purchases and proceeds received by
the Company.
Unrealized gains and losses on available-for-sale securities are excluded from earnings and presented as a
component of accumulated other comprehensive income or loss, net of related deferred taxes. Proceeds from
the sale and maturity of available-for-sale securities during the years ended December 31, 2009, 2008 and
2007 were $8.4 billion, $2.8 billion and $0.2 billion, respectively.
Gains and losses on investments are calculated using the specific-identification method and are
recognized during the period in which the investment is sold or when an investment experiences an
other-than-temporary decline in value. Factors that could indicate an impairment exists include, but are not
limited to: earnings performance, changes in credit rating or adverse changes in the regulatory or economic
environment of the asset. If potential impairment exists, the Company assesses whether it has the intent to sell
the debt security, more likely than not will be required to sell the debt security before its anticipated recovery
or expects that some of the contractual cash flows will not be received. The Company had no material
other-than-temporary impairments during the periods presented.
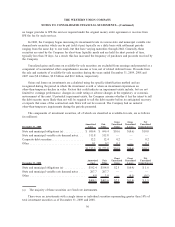
The components of investment securities, all of which are classified as available-for-sale, are as follows
(in millions):
December 31, 2009
Amortized
Cost
Fair
Value
Gross
Unrealized
Gains
Gross
Unrealized
Losses
Net
Unrealized
Gains/(Losses)
State and municipal obligations (a) ............ $ 686.4 $ 696.4 $10.6 $(0.6) $10.0
State and municipal variable rate demand notes . . . 513.8 513.8 — — —
Corporate debt securities .................... 12.2 12.4 0.2 — 0.2
Other .................................. 0.1 0.2 0.1 — 0.1
$1,212.5 $1,222.8 $10.9 $(0.6) $10.3
December 31, 2008
Amortized
Cost
Fair
Value
Gross
Unrealized
Gains
Gross
Unrealized
Losses
Net
Unrealized
Gains/(Losses)
State and municipal obligations (a) ............. $192.4 $194.0 $2.5 $(0.9) $ 1.6
State and municipal variable rate demand notes .... 207.7 207.7 — — —
Other ................................... 4.0 3.9 — (0.1) (0.1)
$404.1 $405.6 $2.5 $(1.0) $ 1.5
(a) The majority of these securities are fixed rate instruments.
There were no investments with a single issuer or individual securities representing greater than 10% of
total investment securities as of December 31, 2009 and 2008.
96
THE WESTERN UNION COMPANY
NOTES TO CONSOLIDATED FINANCIAL STATEMENTS—(Continued)