Western Union 2009 Annual Report Download - page 56
Download and view the complete annual report
Please find page 56 of the 2009 Western Union annual report below. You can navigate through the pages in the report by either clicking on the pages listed below, or by using the keyword search tool below to find specific information within the annual report.-
 1
1 -
2
-
3
-
4
-
5
-
6
-
7
-
8
-
9
-
10
-
11
-
12
-
13
-
14
-
15
-
16
-
17
-
18
-
19
-
20
-
21
-
22
-
23
-
24
-
25
-
26
-
27
-
28
-
29
-
30
-
31
-
32
-
33
-
34
-
35
-
36
-
37
-
38
-
39
-
40
-
41
-
42
-
43
-
44
-
45
-
 46
46 -
 47
47 -
 48
48 -
 49
49 -
 50
50 -
 51
51 -
 52
52 -
 53
53 -
 54
54 -
 55
55 -
 56
56 -
 57
57 -
 58
58 -
 59
59 -
 60
60 -
 61
61 -
 62
62 -
 63
63 -
 64
64 -
 65
65 -
 66
66 -
67
-
68
-
69
-
70
-
71
-
72
-
73
-
74
-
75
-
76
-
77
-
78
-
79
-
80
-
81
-
82
-
83
-
84
-
85
-
86
-
87
-
88
-
89
-
90
-
91
-
92
-
93
-
94
-
95
-
96
-
97
-
98
-
99
-
100
-
101
-
102
-
103
-
104
-
105
-
106
-
107
-
108
-
109
-
110
-
111
-
112
-
113
-
114
-
115
-
116
-
117
-
118
-
119
-
120
-
121
-
122
-
123
-
124
-
125
-
126
-
127
-
128
-
129
-
130
-
131
-
132
-
133
-
134
-
135
-
136
-
137
-
138
-
139
-
140
-
141
-
142
-
143
-
144
-
145
-
146
-
147
-
148
-
149
-
150
-
151
-
152
-
153
 |
 |

multi-state not-for-profit organization promoting safety and security along the United States and Mexico
border, in which California, Texas and New Mexico will participate with Arizona. While this item was
identifiable to our consumer-to-consumer segment, it was not included in the measurement of segment
operating profit provided to the chief operating decision maker (“CODM”) for purposes of assessing segment
performance and decision making with respect to resource allocation. For additional information on the
settlement accrual, refer to “Selling, general and administrative” expenses.
We incurred expenses of $82.9 million for the year ended December 31, 2008 for restructuring and
related activities, which were not allocated to our segments. While these items were identifiable to our
segments, they were not included in the measurement of segment operating profit provided to the CODM for
purposes of assessing segment performance and decision making with respect to resource allocation. For
additional information on restructuring and related activities refer to “Operating expenses overview.”
For the year ended December 31, 2007, we incurred a $22.3 million accelerated stock-based
compensation vesting charge related to the acquisition of First Data by an affiliate of Kohlberg Kravis
Roberts & Co. (“KKR”) which was allocated to our segments. For additional information refer to “Operating
expenses overview.”
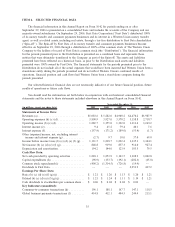
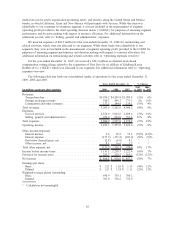
The following table sets forth our consolidated results of operations for the years ended December 31,
2009, 2008 and 2007.
(in millions, except per share amounts) 2009 2008 2007
2009
vs. 2008
2008
vs. 2007
Years Ended December 31, % Change
Revenues:
Transaction fees ................................. $4,036.2 $4,240.8 $3,989.8 (5)% 6%
Foreign exchange revenue .......................... 910.3 896.3 771.3 2% 16%
Commission and other revenues...................... 137.1 144.9 139.1 (5)% 4%
Total revenues .................................... 5,083.6 5,282.0 4,900.2 (4)% 8%
Expenses:
Cost of services ................................. 2,874.9 3,093.0 2,808.4 (7)% 10%
Selling, general and administrative. . . ................. 926.0 834.0 769.8 11% 8%
Total expenses .................................... 3,800.9 3,927.0 3,578.2 (3)% 10%
Operating income .................................. 1,282.7 1,355.0 1,322.0 (5)% 2%
Other income/(expense):
Interest income .................................. 9.4 45.2 79.4 (79)% (43)%
Interest expense ................................. (157.9) (171.2) (189.0) (8)% (9)%
Derivative (losses)/gains, net ........................ (2.8) (6.9) 8.3 * *
Other income, net ................................ 0.1 16.6 1.7 * *
Total other expense, net ............................. (151.2) (116.3) (99.6) 30% 17%
Income before income taxes .......................... 1,131.5 1,238.7 1,222.4 (9)% 1%
Provision for income taxes ........................... 282.7 319.7 365.1 (12)% (12)%
Net income....................................... $ 848.8 $ 919.0 $ 857.3 (8)% 7%
Earnings per share:
Basic ......................................... $ 1.21 $ 1.26 $ 1.13 (4)% 12%
Diluted ........................................ $ 1.21 $ 1.24 $ 1.11 (2)% 12%
Weighted-average shares outstanding:
Basic ......................................... 698.9 730.1 760.2
Diluted ........................................ 701.0 738.2 772.9
* Calculation not meaningful
42