Western Union 2009 Annual Report Download - page 90
Download and view the complete annual report
Please find page 90 of the 2009 Western Union annual report below. You can navigate through the pages in the report by either clicking on the pages listed below, or by using the keyword search tool below to find specific information within the annual report.-
 1
1 -
2
-
3
-
4
-
5
-
6
-
7
-
8
-
9
-
10
-
11
-
12
-
13
-
14
-
15
-
16
-
17
-
18
-
19
-
20
-
21
-
22
-
23
-
24
-
25
-
26
-
27
-
28
-
29
-
30
-
31
-
32
-
33
-
34
-
35
-
36
-
37
-
38
-
39
-
40
-
41
-
42
-
43
-
44
-
45
-
46
-
47
-
48
-
49
-
50
-
51
-
52
-
53
-
54
-
55
-
56
-
57
-
58
-
59
-
60
-
61
-
62
-
63
-
64
-
65
-
66
-
67
-
68
-
69
-
70
-
71
-
72
-
73
-
74
-
75
-
76
-
77
-
78
-
79
-
 80
80 -
 81
81 -
 82
82 -
 83
83 -
 84
84 -
 85
85 -
 86
86 -
 87
87 -
 88
88 -
 89
89 -
 90
90 -
 91
91 -
 92
92 -
 93
93 -
 94
94 -
 95
95 -
 96
96 -
 97
97 -
 98
98 -
 99
99 -
 100
100 -
101
-
102
-
103
-
104
-
105
-
106
-
107
-
108
-
109
-
110
-
111
-
112
-
113
-
114
-
115
-
116
-
117
-
118
-
119
-
120
-
121
-
122
-
123
-
124
-
125
-
126
-
127
-
128
-
129
-
130
-
131
-
132
-
133
-
134
-
135
-
136
-
137
-
138
-
139
-
140
-
141
-
142
-
143
-
144
-
145
-
146
-
147
-
148
-
149
-
150
-
151
-
152
-
153
 |
 |

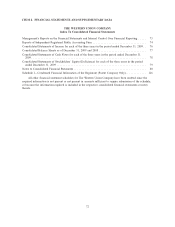
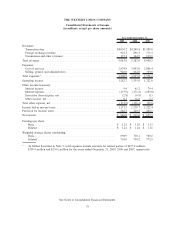
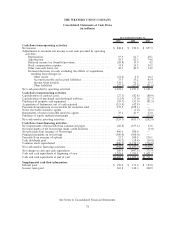
THE WESTERN UNION COMPANY
Consolidated Statements of Income
(in millions, except per share amounts)
2009 2008 2007
Year Ended December 31,
Revenues:
Transaction fees ............................................ $4,036.2 $4,240.8 $3,989.8
Foreign exchange revenue ..................................... 910.3 896.3 771.3
Commission and other revenues ................................. 137.1 144.9 139.1
Total revenues................................................ 5,083.6 5,282.0 4,900.2
Expenses:
Cost of services ............................................. 2,874.9 3,093.0 2,808.4
Selling, general and administrative ............................... 926.0 834.0 769.8
Total expenses*............................................... 3,800.9 3,927.0 3,578.2
Operating income ............................................. 1,282.7 1,355.0 1,322.0
Other income/(expense):
Interest income ............................................. 9.4 45.2 79.4
Interest expense............................................. (157.9) (171.2) (189.0)
Derivative (losses)/gains, net ................................... (2.8) (6.9) 8.3
Other income, net ........................................... 0.1 16.6 1.7
Total other expense, net......................................... (151.2) (116.3) (99.6)
Income before income taxes ..................................... 1,131.5 1,238.7 1,222.4
Provision for income taxes ...................................... 282.7 319.7 365.1
Net income .................................................. $ 848.8 $ 919.0 $ 857.3
Earnings per share:
Basic ................................................... $ 1.21 $ 1.26 $ 1.13
Diluted ................................................. $ 1.21 $ 1.24 $ 1.11
Weighted-average shares outstanding:
Basic ................................................... 698.9 730.1 760.2
Diluted ................................................. 701.0 738.2 772.9
* As further described in Note 5, total expenses include amounts for related parties of $257.4 million,
$305.9 million and $256.6 million for the years ended December 31, 2009, 2008 and 2007, respectively.
See Notes to Consolidated Financial Statements.
76