Western Union 2009 Annual Report Download - page 120
Download and view the complete annual report
Please find page 120 of the 2009 Western Union annual report below. You can navigate through the pages in the report by either clicking on the pages listed below, or by using the keyword search tool below to find specific information within the annual report.-
 1
1 -
2
-
3
-
4
-
5
-
6
-
7
-
8
-
9
-
10
-
11
-
12
-
13
-
14
-
15
-
16
-
17
-
18
-
19
-
20
-
21
-
22
-
23
-
24
-
25
-
26
-
27
-
28
-
29
-
30
-
31
-
32
-
33
-
34
-
35
-
36
-
37
-
38
-
39
-
40
-
41
-
42
-
43
-
44
-
45
-
46
-
47
-
48
-
49
-
50
-
51
-
52
-
53
-
54
-
55
-
56
-
57
-
58
-
59
-
60
-
61
-
62
-
63
-
64
-
65
-
66
-
67
-
68
-
69
-
70
-
71
-
72
-
73
-
74
-
75
-
76
-
77
-
78
-
79
-
80
-
81
-
82
-
83
-
84
-
85
-
86
-
87
-
88
-
89
-
90
-
91
-
92
-
93
-
94
-
95
-
96
-
97
-
98
-
99
-
100
-
101
-
102
-
103
-
104
-
105
-
106
-
107
-
108
-
109
-
 110
110 -
 111
111 -
 112
112 -
 113
113 -
 114
114 -
 115
115 -
 116
116 -
 117
117 -
 118
118 -
 119
119 -
 120
120 -
 121
121 -
 122
122 -
 123
123 -
 124
124 -
 125
125 -
 126
126 -
 127
127 -
 128
128 -
 129
129 -
 130
130 -
131
-
132
-
133
-
134
-
135
-
136
-
137
-
138
-
139
-
140
-
141
-
142
-
143
-
144
-
145
-
146
-
147
-
148
-
149
-
150
-
151
-
152
-
153
 |
 |

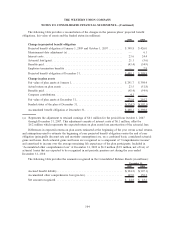
Pension plan asset allocation at December 31, 2009 and 2008, and target allocations based on investment
policies, were as follows:
Asset Category 2009 2008
Percentage of Plan Assets
at Measurement Date
Equity investments ............................................ 32% 24%
Debt securities ............................................... 68% 75%
Other ...................................................... 0% 1%
100% 100%
Target Allocation
Equity investments ................................................. 25-35%
Debt securities .................................................... 65-75%
The assets of the Company’s defined benefit plans are managed in a third-party Trust. The investment
policy and allocation of the assets in the Trust are overseen by the Company’s Investment Council. Western
Union employs a total return investment approach whereby a mix of equities and fixed income investments are
used in an effort to maximize the long-term return of plan assets for a prudent level of risk. Risk tolerance is
established through careful consideration of plan liabilities and plan funded status. The investment portfolio
contains a diversified blend of equity and fixed-income investments. Furthermore, equity investments are
diversified across United States and non-United States stocks, as well as securities deemed to be growth,
value, and small and large capitalizations. Other assets, primarily private equity, are used judiciously in an
effort to enhance long-term returns while improving portfolio diversification. The Company’s defined benefit
plans also include certain derivatives. On behalf of the Plans, investment advisors may enter into futures
contracts to manage interest rate risks. These contracts are contractual obligations to buy or sell a United
States treasury bond or note at predetermined future dates and prices. Futures are transacted in standardized
amounts on regulated exchanges. Investment risk is measured and monitored on an ongoing basis through
quarterly investment portfolio reviews, annual liability measurements, and periodic asset and liability studies.
The following table reflects investments of the Trust that were measured and carried at fair value as of
December 31, 2009 (in millions). For information on how Western Union measures fair value, refer to Note 2,
“Summary of Significant Accounting Policies.”
Asset Category Level 1 Level 2 Level 3
Total Assets
at Fair Value
Fair Value Measurement Using
Equity investments (a)
Domestic ........................................ $ 5.7 $ 35.4 $ — $ 41.1
International...................................... — 43.1 — 43.1
Private equity ..................................... — — 2.0 2.0
Debt securities
Corporate debt (b) ................................. — 119.3 — 119.3
U.S. treasury bonds ................................ 46.6 — — 46.6
U.S. government agencies ............................ — 9.6 — 9.6
Asset-backed ..................................... — 8.7 — 8.7
Other bonds ...................................... — 2.9 — 2.9
Total investments of the Trust at fair value ................... $52.3 $219.0 $2.0 $273.3
Other assets (c) ....................................... 2.6
Total investments of the Trust ............................ $52.3 $219.0 $2.0 $275.9
106
THE WESTERN UNION COMPANY
NOTES TO CONSOLIDATED FINANCIAL STATEMENTS—(Continued)