Western Union 2009 Annual Report Download - page 67
Download and view the complete annual report
Please find page 67 of the 2009 Western Union annual report below. You can navigate through the pages in the report by either clicking on the pages listed below, or by using the keyword search tool below to find specific information within the annual report.-
 1
1 -
2
-
3
-
4
-
5
-
6
-
7
-
8
-
9
-
10
-
11
-
12
-
13
-
14
-
15
-
16
-
17
-
18
-
19
-
20
-
21
-
22
-
23
-
24
-
25
-
26
-
27
-
28
-
29
-
30
-
31
-
32
-
33
-
34
-
35
-
36
-
37
-
38
-
39
-
40
-
41
-
42
-
43
-
44
-
45
-
46
-
47
-
48
-
49
-
50
-
51
-
52
-
53
-
54
-
55
-
56
-
 57
57 -
 58
58 -
 59
59 -
 60
60 -
 61
61 -
 62
62 -
 63
63 -
 64
64 -
 65
65 -
 66
66 -
 67
67 -
 68
68 -
 69
69 -
 70
70 -
 71
71 -
 72
72 -
 73
73 -
 74
74 -
 75
75 -
 76
76 -
 77
77 -
78
-
79
-
80
-
81
-
82
-
83
-
84
-
85
-
86
-
87
-
88
-
89
-
90
-
91
-
92
-
93
-
94
-
95
-
96
-
97
-
98
-
99
-
100
-
101
-
102
-
103
-
104
-
105
-
106
-
107
-
108
-
109
-
110
-
111
-
112
-
113
-
114
-
115
-
116
-
117
-
118
-
119
-
120
-
121
-
122
-
123
-
124
-
125
-
126
-
127
-
128
-
129
-
130
-
131
-
132
-
133
-
134
-
135
-
136
-
137
-
138
-
139
-
140
-
141
-
142
-
143
-
144
-
145
-
146
-
147
-
148
-
149
-
150
-
151
-
152
-
153
 |
 |

lower stock-based compensation expenses. Of the $22.3 million accelerated stock-based compensation vesting
charge in 2007 taken in connection with the change in control of First Data, that did not recur in 2008,
$18.9 million was allocated to this segment in 2007. During the year ended December 31, 2008 compared to
2007, the operating income increase was partially offset by revenue declines in our United States businesses,
and higher employee compensation expenses. The ongoing shift in our business mix reflecting stronger growth
in our international business, which carries lower profit margins than in our United States originated business,
also impacted consumer-to-consumer operating income during the year ended December 31, 2008. As
described earlier in the revenues overview and due to the same factors, operating income growth for the
consumer-to-consumer segment was lower in the fourth quarter of 2008 than that experienced in the previous
nine months.
Consumer-to-consumer operating income margin also increased during the year ended December 31,
2008 compared to 2007, primarily due to lower stock-based compensation expense, as described above. This
increase was partially offset by revenue declines in our United States businesses and the shift in our business
mix reflecting stronger growth in our international business, which carries lower profit margins than in our
United States originated business as noted earlier. However, we have been experiencing a convergence between
international operating profits margins and profit margins of our United States originated businesses.
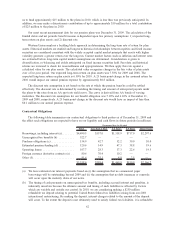
Global Business Payments Segment
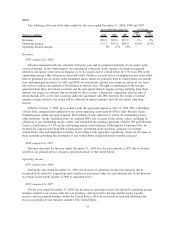
The following table sets forth our global business payments segment results of operations for the years
ended December 31, 2009, 2008 and 2007.
(dollars and transactions in millions) 2009 2008 2007
2009
vs. 2008
2008
vs. 2007
Years Ended December 31, % Change
Revenues:
Transaction fees ..................................... $621.9 $668.1 $665.5 (7)% 0%
Foreign exchange revenue ............................. 33.2 3.2 2.0 * *
Other revenues...................................... 36.6 48.5 52.4 (25)% (7)%
Total revenues ...................................... $691.7 $719.8 $719.9 (4)% 0%
Operating income ................................... $171.9 $199.4 $223.7 (14)% (11)%
Operating income margin .............................. 25% 28% 31%
Key indicator:
Global business payments transactions .................... 414.8 412.1 404.5 1% 2%
* Calculation not meaningful
Revenues
2009 compared to 2008
During the year ended December 31, 2009, the global business payments segment revenue was adversely
impacted by the weak economic situation in the United States, which resulted in a revenue decline in our
United States cash and electronic bill payments businesses, partially offset by revenue generated from our
recent acquisition of Custom House, as described below, and slight growth in the Pago Fácil business. We
believe many United States consumers who would use our services are having difficulty paying their bills and
are unable to obtain credit, resulting in our handling fewer bill payments. Due to a continued challenging
United States economy and competitive pressure, we expect to see revenue declines in our United States
consumer-to-business service offerings in 2010 similar to the declines we experienced in 2009. Although the
segment’s revenues were primarily generated in the United States for the year ended December 31, 2009, we
expect the proportion of international revenue, specifically foreign exchange revenue, will grow in future
periods as a percentage of total revenue due to our acquisition of Custom House.
53