Western Union 2009 Annual Report Download - page 65
Download and view the complete annual report
Please find page 65 of the 2009 Western Union annual report below. You can navigate through the pages in the report by either clicking on the pages listed below, or by using the keyword search tool below to find specific information within the annual report.-
 1
1 -
2
-
3
-
4
-
5
-
6
-
7
-
8
-
9
-
10
-
11
-
12
-
13
-
14
-
15
-
16
-
17
-
18
-
19
-
20
-
21
-
22
-
23
-
24
-
25
-
26
-
27
-
28
-
29
-
30
-
31
-
32
-
33
-
34
-
35
-
36
-
37
-
38
-
39
-
40
-
41
-
42
-
43
-
44
-
45
-
46
-
47
-
48
-
49
-
50
-
51
-
52
-
53
-
54
-
 55
55 -
 56
56 -
 57
57 -
 58
58 -
 59
59 -
 60
60 -
 61
61 -
 62
62 -
 63
63 -
 64
64 -
 65
65 -
 66
66 -
 67
67 -
 68
68 -
 69
69 -
 70
70 -
 71
71 -
 72
72 -
 73
73 -
 74
74 -
 75
75 -
76
-
77
-
78
-
79
-
80
-
81
-
82
-
83
-
84
-
85
-
86
-
87
-
88
-
89
-
90
-
91
-
92
-
93
-
94
-
95
-
96
-
97
-
98
-
99
-
100
-
101
-
102
-
103
-
104
-
105
-
106
-
107
-
108
-
109
-
110
-
111
-
112
-
113
-
114
-
115
-
116
-
117
-
118
-
119
-
120
-
121
-
122
-
123
-
124
-
125
-
126
-
127
-
128
-
129
-
130
-
131
-
132
-
133
-
134
-
135
-
136
-
137
-
138
-
139
-
140
-
141
-
142
-
143
-
144
-
145
-
146
-
147
-
148
-
149
-
150
-
151
-
152
-
153
 |
 |
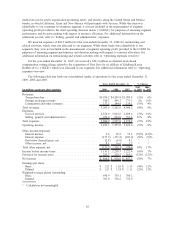
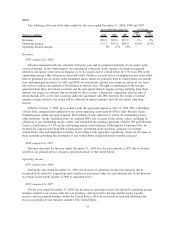
factors. Fee decreases and foreign exchange actions generally reduce margins, but are done in anticipation that
they will result in increased transaction volumes and increased revenues over time. For the year ended
December 31, 2009, such fee decreases and foreign exchange actions were approximately 2% of total Western
Union revenue compared to 1% and 3% for the years ended December 31, 2008 and 2007, respectively.
The majority of transaction growth is derived from more mature agent locations; new agent locations
typically contribute only marginally to growth in the first few years of their operation. Increased productivity,
measured by transactions per location, is often experienced as locations mature. We believe that new agent
locations will help drive growth by increasing the number of locations available to send and receive money.
We generally refer to locations with more than 50% of transactions being initiated (versus paid) as “send
locations” and to the balance of locations as “receive locations.” Send locations are the engine that drives
consumer-to-consumer revenue. They contribute more transactions per location than receive locations.
However, a wide network of receive locations is necessary to build each corridor and to help ensure global
distribution and convenience for consumers. The number of send and receive transactions at an agent location
can vary significantly due to such factors as customer demographics around the location, migration patterns,
the location’s class of trade, hours of operation, length of time the location has been offering our services,
regulatory limitations and competition. Each of the 410,000 agent locations in our agent network is capable of
providing one or more of our services; however, not every location completes a transaction in a given period.
For example, as of December 31, 2009, more than 85% of agent locations in the United States, Canada and
Western Europe (representing at least one of our three money transfer brands: Western Union», Orlandi
Valuta»and Vigo
SM
) experienced money transfer activity in the previous 12 months. In the developing regions
of Asia and other areas where there are primarily receive locations, approximately 70% of locations
experienced money transfer activity in the previous 12 months. We periodically review locations to determine
whether they remain enabled to perform money transfer transactions.
2008 compared to 2007
Consumer-to-consumer money transfer revenue growth was 9% for the year ended December 31, 2008
over the same period in 2007. This increase was driven by revenue growth of 13% in our international
business on transaction growth of 17%. Our international consumer-to-consumer business outside of the
United States also continued to experience strong revenue growth for the year ended December 31, 2008 as a
result of strong transaction growth.
However, during the fourth quarter of 2008, revenue was impacted by the weakening global economy and
its effect on Western Union customers. In the fourth quarter, transaction growth rates slowed sequentially
compared to the first nine months of 2008. In addition, the amount of money remitted per transaction declined
in the fourth quarter of 2008 compared to the fourth quarter of 2007. These factors resulted in less transaction
fee and foreign exchange revenue in the fourth quarter of 2008 compared to the fourth quarter of 2007.
Revenue growth in our EMEASA region was 16% on transaction growth of 23% for the year ended
December 31, 2008 over the same period in 2007. The growth in our EMEASA region during the year ended
December 31, 2008, was primarily driven by transaction growth and the impact of translating foreign currency
denominated revenues into the United States dollar, specifically the euro, as further described below.
Contributing to the growth in the EMEASA region was strong transaction growth of over 60% in our money
transfer business to India for the year ended December 31, 2008 compared to the corresponding period in
2007, resulting in revenue growth of over 45%. Over the same period, revenue growth in the Gulf States
continued to be strong. However, revenue growth in some European markets during the year ended
December 31, 2008 slowed over the previous year, especially during the fourth quarter of 2008 as certain
countries within Europe, such as Spain, experienced declines in the housing industry and rising
unemployment.
Fluctuations in the exchange rate between the United States dollar and currencies other than the
United States dollar for the year ended December 31, 2008 resulted in a benefit to transaction fee and foreign
exchange revenue of $96 million, over the previous year, net of foreign currency hedges, that would not have
occurred had there been constant currency rates. The positive impact to operating profit derived from foreign
51