TripAdvisor 2014 Annual Report Download - page 53
Download and view the complete annual report
Please find page 53 of the 2014 TripAdvisor annual report below. You can navigate through the pages in the report by either clicking on the pages listed below, or by using the keyword search tool below to find specific information within the annual report.-
 1
1 -
2
-
3
-
4
-
5
-
6
-
7
-
8
-
9
-
10
-
11
-
12
-
13
-
14
-
15
-
16
-
17
-
18
-
19
-
20
-
21
-
22
-
23
-
24
-
25
-
26
-
27
-
28
-
29
-
30
-
31
-
32
-
33
-
34
-
35
-
36
-
37
-
38
-
39
-
40
-
41
-
42
-
 43
43 -
 44
44 -
 45
45 -
 46
46 -
 47
47 -
 48
48 -
 49
49 -
 50
50 -
 51
51 -
 52
52 -
 53
53 -
 54
54 -
 55
55 -
 56
56 -
 57
57 -
 58
58 -
 59
59 -
 60
60 -
 61
61 -
 62
62 -
 63
63 -
64
-
65
-
66
-
67
-
68
-
69
-
70
-
71
-
72
-
73
-
74
-
75
-
76
-
77
-
78
-
79
-
80
-
81
-
82
-
83
-
84
-
85
-
86
-
87
-
88
-
89
-
90
-
91
-
92
-
93
-
94
-
95
-
96
-
97
-
98
-
99
-
100
-
101
-
102
-
103
-
104
-
105
-
106
-
107
-
108
-
109
-
110
-
111
-
112
-
113
-
114
-
115
-
116
-
117
-
118
-
119
-
120
-
121
-
122
-
123
-
124
-
125
-
126
-
127
-
128
-
129
-
130
-
131
-
132
-
133
-
134
-
135
-
136
-
137
-
138
-
139
-
140
-
141
-
142
-
143
-
144
-
145
-
146
-
147
-
148
-
149
-
150
-
151
-
152
-
153
-
154
-
155
-
156
-
157
-
158
-
159
-
160
-
161
-
162
-
163
-
164
-
165
-
166
-
167
-
168
-
169
-
170
-
171
-
172
 |
 |

43
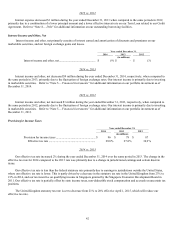
2013 vs. 2012
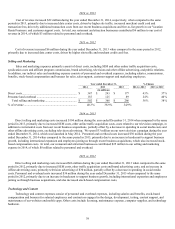
Our effective tax rate decreased 2% during the year ended December 31, 2013 over the same period in 2012.
The decrease in the effective tax rate for 2013 compared to the 2012 rate was primarily due to an increase in earnings in
jurisdictions outside the United States as well as an internal restructuring that occurred during the fourth quarter of 2012. This
restructuring was undertaken within our non-U.S. operations to align our global structure for more efficient treasury management and
global cash deployment. Additionally, during the third quarter of 2013, Massachusetts enacted a statute that changed how sales are
apportioned from being a cost of performance measure to market based sourcing, which resulted in a lower overall state effective tax
rate.
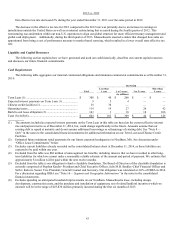
Liquidity and Capital Resources
The following section explains how we have generated and used our cash historically, describes our current capital resources
and discusses our future financial commitments.
Cash Requirements
The following table aggregates our material contractual obligations and minimum commercial commitments as of December 31,
2014:
By Period
Total
Less than
1 year 1 to 3 years 3 to 5 years
More than
5 years
(in millions)
Term Loan (1) ......................................................................
$300 $40 $ 260 $ — $ —
Expected interest payments on Term Loan (1) ....................
9 5 4 — —
Chinese credit facilities (1) ..................................................
38 38 — — —
Operating leases ...................................................................
114 19 27 26 42
Build to suit lease obligation (2) ..........................................
143 1 18 18 106
Total (3)(4)(5)(6) .................................................................. $604 $103 $ 309 $ 44 $ 148
(1) The amounts included as expected interest payments on the Term Loan in this table are based on the current effective interest
rate and payment terms as of December 31, 2014, but, could change significantly in the future. Amounts assume that our
existing debt is repaid at maturity and do not assume additional borrowings or refinancings of existing debt. See “Note 8—
Debt” in the notes to the consolidated financial statements for additional information on our Term Loan and Chinese Credit
Facilities.
(2) Estimated future minimum rental payments for our future corporate headquarters in Needham, MA. See discussion under
“Office Lease Commitments” below.
(3) Excludes current liabilities already recorded on the consolidated balance sheet at December 31, 2014, as these liabilities are
expected to be paid within one year.
(4) Excluded from the table was $68 million of unrecognized tax benefits, including interest, that we have recorded in other long-
term liabilities for which we cannot make a reasonably reliable estimate of the amount and period of payment. We estimate that
approximately $1 million will be paid within the next twelve months.
(5) Excluded from the table is our obligation to fund a charitable foundation. The Board of Directors of the charitable foundation is
currently comprised of Stephen Kaufer- President and Chief Executive Officer, Julie M.B. Bradley-Chief Financial Officer and
Seth J. Kalvert- Senior Vice President, General Counsel and Secretary. Our obligation was calculated at 2.0% of OIBA in 2014.
For a discussion regarding OIBA see “Note 16— Segment and Geographic Information” in the notes to the consolidated
financial statements.
(6) Excludes spending on anticipated leasehold improvements on our Needham, Massachusetts lease, including design,
development, construction costs, and the purchase and installation of equipment, net of related landlord incentives which we
estimate will be in the range of $25-$30 million primarily incurred during the first six months of 2015.