TripAdvisor 2014 Annual Report Download - page 50
Download and view the complete annual report
Please find page 50 of the 2014 TripAdvisor annual report below. You can navigate through the pages in the report by either clicking on the pages listed below, or by using the keyword search tool below to find specific information within the annual report.-
 1
1 -
2
-
3
-
4
-
5
-
6
-
7
-
8
-
9
-
10
-
11
-
12
-
13
-
14
-
15
-
16
-
17
-
18
-
19
-
20
-
21
-
22
-
23
-
24
-
25
-
26
-
27
-
28
-
29
-
30
-
31
-
32
-
33
-
34
-
35
-
36
-
37
-
38
-
39
-
 40
40 -
 41
41 -
 42
42 -
 43
43 -
 44
44 -
 45
45 -
 46
46 -
 47
47 -
 48
48 -
 49
49 -
 50
50 -
 51
51 -
 52
52 -
 53
53 -
 54
54 -
 55
55 -
 56
56 -
 57
57 -
 58
58 -
 59
59 -
 60
60 -
61
-
62
-
63
-
64
-
65
-
66
-
67
-
68
-
69
-
70
-
71
-
72
-
73
-
74
-
75
-
76
-
77
-
78
-
79
-
80
-
81
-
82
-
83
-
84
-
85
-
86
-
87
-
88
-
89
-
90
-
91
-
92
-
93
-
94
-
95
-
96
-
97
-
98
-
99
-
100
-
101
-
102
-
103
-
104
-
105
-
106
-
107
-
108
-
109
-
110
-
111
-
112
-
113
-
114
-
115
-
116
-
117
-
118
-
119
-
120
-
121
-
122
-
123
-
124
-
125
-
126
-
127
-
128
-
129
-
130
-
131
-
132
-
133
-
134
-
135
-
136
-
137
-
138
-
139
-
140
-
141
-
142
-
143
-
144
-
145
-
146
-
147
-
148
-
149
-
150
-
151
-
152
-
153
-
154
-
155
-
156
-
157
-
158
-
159
-
160
-
161
-
162
-
163
-
164
-
165
-
166
-
167
-
168
-
169
-
170
-
171
-
172
 |
 |

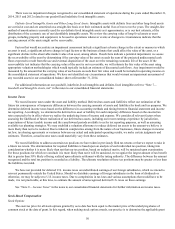
40
Year ended December 31, % Change
2014 2013 2012 2014 vs 2013 2013 vs 2012
(in millions)
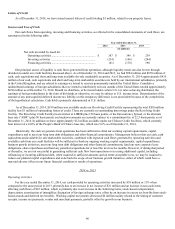
Personnel and overhead ...................................................... $ 147 $ 114 $ 76 29% 50%
Other ................................................................................... 24 17 11 41% 55%
Total technology and content ......................................... $ 171 $ 131 $ 87 31% 51%
% of revenue ....................................................................... 13.7% 13.9% 11.4 %
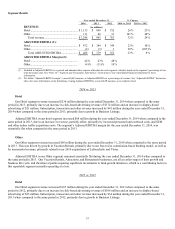
2014 vs. 2013
Technology and content costs increased $40 million during the year ended December 31, 2014 when compared to the same
period in 2013, primarily due to increased personnel costs from increased headcount to support business growth, including
international expansion and enhanced site features, as well as additional personnel costs related to employees joining us through recent
business acquisitions and also increased stock-based compensation costs. In total, our restaurant and attraction businesses contributed
$6 million to our technology and content expense in 2014, of which $4 million related to personnel and overhead.
2013 vs. 2012
Technology and content costs increased $44 million during the year ended December 31, 2013 when compared to the same
period in 2012, primarily due to increased personnel costs from increased headcount to support business growth, including
international expansion, enhanced site features, extending our products onto smartphone and tablet platforms, and development of our
hotel metasearch product, as well as an increase in stock based compensation and additional personnel costs related to employees
joining us through business acquisitions.
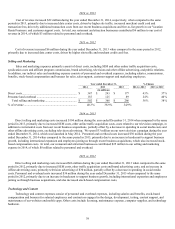
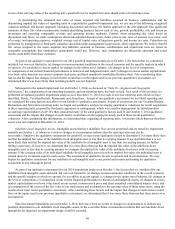
General and Administrative
General and administrative expense consists primarily of personnel and related overhead costs, for personnel engaged in
executive leadership, finance, legal, and human resources and stock-based compensation as well as professional service fees and other
fees including audit, legal, tax and accounting, and other costs including bad debt expense and our charitable foundation costs.
Year ended December 31, % Change
2014 2013 2012 2014 vs 2013 2013 vs 2012
(in millions)
Personnel and overhead ...................................................... $ 87 $ 66 $ 51 32% 29%
Professional service fees and other ..................................... 41 32 25 28% 28%
Total general and administrative .................................... $ 128 $ 98 $ 76 31% 29%
% of revenue .................................................................. 10.3% 10.4% 10.0 %
2014 vs. 2013
General and administrative costs increased $30 million during the year ended December 31, 2014, when compared to the same
period in 2013, primarily due to personnel costs and overhead costs related to an increase in headcount to support our business
operations, as well as additional personnel costs related to employees joining us through recent business acquisitions and professional
fees primarily related to our 2014 business acquisitions, higher charitable contributions and increased bad debt expense. In total, our
restaurant and attraction businesses contributed $8 million to our cost of revenue in 2014, of which $5 million related to personnel and
overhead.
2013 vs. 2012
General and administrative costs increased $22 million during the year ended December 31, 2013, when compared to the same
period in 2012, primarily due to increased personnel costs related to an increase in stock-based compensation, as well as increased
headcount to support business growth and additional professional service fees in order to support our operations and an increase in our
bad debt provision.