TripAdvisor 2014 Annual Report Download - page 47
Download and view the complete annual report
Please find page 47 of the 2014 TripAdvisor annual report below. You can navigate through the pages in the report by either clicking on the pages listed below, or by using the keyword search tool below to find specific information within the annual report.-
 1
1 -
2
-
3
-
4
-
5
-
6
-
7
-
8
-
9
-
10
-
11
-
12
-
13
-
14
-
15
-
16
-
17
-
18
-
19
-
20
-
21
-
22
-
23
-
24
-
25
-
26
-
27
-
28
-
29
-
30
-
31
-
32
-
33
-
34
-
35
-
36
-
 37
37 -
 38
38 -
 39
39 -
 40
40 -
 41
41 -
 42
42 -
 43
43 -
 44
44 -
 45
45 -
 46
46 -
 47
47 -
 48
48 -
 49
49 -
 50
50 -
 51
51 -
 52
52 -
 53
53 -
 54
54 -
 55
55 -
 56
56 -
 57
57 -
58
-
59
-
60
-
61
-
62
-
63
-
64
-
65
-
66
-
67
-
68
-
69
-
70
-
71
-
72
-
73
-
74
-
75
-
76
-
77
-
78
-
79
-
80
-
81
-
82
-
83
-
84
-
85
-
86
-
87
-
88
-
89
-
90
-
91
-
92
-
93
-
94
-
95
-
96
-
97
-
98
-
99
-
100
-
101
-
102
-
103
-
104
-
105
-
106
-
107
-
108
-
109
-
110
-
111
-
112
-
113
-
114
-
115
-
116
-
117
-
118
-
119
-
120
-
121
-
122
-
123
-
124
-
125
-
126
-
127
-
128
-
129
-
130
-
131
-
132
-
133
-
134
-
135
-
136
-
137
-
138
-
139
-
140
-
141
-
142
-
143
-
144
-
145
-
146
-
147
-
148
-
149
-
150
-
151
-
152
-
153
-
154
-
155
-
156
-
157
-
158
-
159
-
160
-
161
-
162
-
163
-
164
-
165
-
166
-
167
-
168
-
169
-
170
-
171
-
172
 |
 |

37
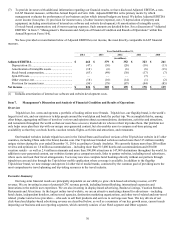
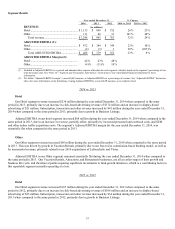
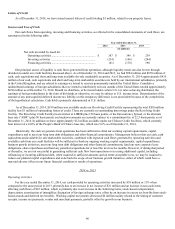
Segment Results
Year ended December 31, % Change
2014 2013 2012 2014 vs. 2013 2013 vs. 2012
REVENUE: (in millions)
Hotel ............................................................... $1,135 $899 $732 26 % 23%
Other ............................................................... 111 46 31 141 % 48%
Total revenue ............................................. $1,246 $945 $763 32 % 24%
ADJUSTED EBITDA (1):
Hotel ............................................................... $472 $384 $349 23 % 10%
Other ............................................................... (4) (5) 3 20 % (267)%
Total ADJUSTED EBITDA...................... $468 $379 $352 23 % 8%
ADJUSTED EBITDA Margin (2):
Hotel ............................................................... 42% 43% 48%
Other ............................................................... (4)% (11)% 10%
(1) Included in Adjusted EBITDA is a general and administrative expense allocation for each segment, which is based on the segment’s percentage of our
total personnel costs. See “Note 16 — Segment and Geographic Information,” in the notes to our consolidated financial statements for more
information.
(2) We define “Adjusted EBITDA margin”, a non-GAAP measure, as Adjusted EBITDA as a percentage of revenue. See “Adjusted EBITDA” discussion
above for more information on the limitations of using Adjusted EBITDA, a non-GAAP measure, as an analytical tool.
2014 vs. 2013
Hotel
Our Hotel segment revenue increased $236 million during the year ended December 31, 2014 when compared to the same
period in 2013, primarily due to an increase in click-based advertising revenue of $174 million and an increase in display-based
advertising of $21 million. Subscription, transaction and other revenue increased by $41 million during the year ended December 31,
2014 when compared to the same period in 2013, primarily due to growth in Business Listings.
Adjusted EBITDA in our hotel segment increased $88 million during the year ended December 31, 2014 when compared to the
same period in 2013, due to an increase in revenue, partially offset, primarily by increased personnel and overhead costs, and SEM
and other online traffic acquisition costs. The segment’s Adjusted EBITDA margin for the year ended December 31, 2014, was
essentially flat when compared to the same period in 2013.
Other
Our Other segment revenue increased $65 million during the year ended December 31, 2014 when compared to the same period
in 2013. This was driven by growth in Vacation Rentals, primarily due to our free-to-list commission-based booking model, as well as
by incremental revenue, primarily related to our 2014 acquisitions of Lafourchette and Viator.
Adjusted EBITDA in our Other segment remained essentially flat during the year ended December 31, 2014 when compared to
the same period in 2013. Our Vacation Rentals, Attractions, and Restaurants businesses, are all at earlier stages of their growth and
business life cycle, and therefore at points requiring significant investments to fund growth initiatives, which is a contributing factor to
this reportable segment currently operating at a loss.
2013 vs. 2012
Hotel
Our Hotel segment revenue increased $167 million during the year ended December 31, 2013 when compared to the same
period in 2012, primarily due to an increase in click-based advertising revenue of $108 million and an increase in display-based
advertising of $25 million. Subscription, transaction and other revenue increased by $34 million during the year ended December 31,
2013 when compared to the same period in 2012, primarily due to growth in Business Listings.