TripAdvisor 2014 Annual Report Download - page 105
Download and view the complete annual report
Please find page 105 of the 2014 TripAdvisor annual report below. You can navigate through the pages in the report by either clicking on the pages listed below, or by using the keyword search tool below to find specific information within the annual report.-
 1
1 -
2
-
3
-
4
-
5
-
6
-
7
-
8
-
9
-
10
-
11
-
12
-
13
-
14
-
15
-
16
-
17
-
18
-
19
-
20
-
21
-
22
-
23
-
24
-
25
-
26
-
27
-
28
-
29
-
30
-
31
-
32
-
33
-
34
-
35
-
36
-
37
-
38
-
39
-
40
-
41
-
42
-
43
-
44
-
45
-
46
-
47
-
48
-
49
-
50
-
51
-
52
-
53
-
54
-
55
-
56
-
57
-
58
-
59
-
60
-
61
-
62
-
63
-
64
-
65
-
66
-
67
-
68
-
69
-
70
-
71
-
72
-
73
-
74
-
75
-
76
-
77
-
78
-
79
-
80
-
81
-
82
-
83
-
84
-
85
-
86
-
87
-
88
-
89
-
90
-
91
-
92
-
93
-
94
-
 95
95 -
 96
96 -
 97
97 -
 98
98 -
 99
99 -
 100
100 -
 101
101 -
 102
102 -
 103
103 -
 104
104 -
 105
105 -
 106
106 -
 107
107 -
 108
108 -
 109
109 -
 110
110 -
 111
111 -
 112
112 -
 113
113 -
 114
114 -
 115
115 -
116
-
117
-
118
-
119
-
120
-
121
-
122
-
123
-
124
-
125
-
126
-
127
-
128
-
129
-
130
-
131
-
132
-
133
-
134
-
135
-
136
-
137
-
138
-
139
-
140
-
141
-
142
-
143
-
144
-
145
-
146
-
147
-
148
-
149
-
150
-
151
-
152
-
153
-
154
-
155
-
156
-
157
-
158
-
159
-
160
-
161
-
162
-
163
-
164
-
165
-
166
-
167
-
168
-
169
-
170
-
171
-
172
 |
 |

95
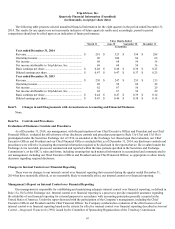
Year ended December 31, 2013
Hotel Other Corporate and
unallocated Total
(in millions)
Revenue ............................................................. $899 $ 46 $ — $ 945
Adjusted EBITDA (1) ....................................... 384 (5) — 379
Depreciation ...................................................... — — (30 ) (30)
Amortization of intangible assets ...................... — — (6 ) (6)
Stock-based compensation ................................ — — (49 ) (49)
Operating income (loss) .................................... $384 $ (5) $ (85 ) 294
Other expense, net ............................................. (10)
Income before income taxes .............................. 284
Provision for income taxes ................................ (79)
N
et income ........................................................ 205
Year ended December 31, 2012
Hotel Other Corporate and
unallocated Total
(in millions)
Revenue ............................................................. $732 $ 31 $ — $ 763
Adjusted EBITDA (1) ....................................... 349 3 — 352
Depreciation ...................................................... — — (20 ) (20)
Amortization of intangible assets ...................... — — (6 ) (6)
Stock-based compensation ................................ — — (30 ) (30)
Operating income (loss) .................................... $349 $ 3 $ (56 ) 296
Other expense, net ............................................. (14)
Income before income taxes .............................. 282
Provision for income taxes ................................ (87)
N
et income ........................................................ 195
(1) Includes allocated general and administrative expenses in our Hotel segment of $87 million, $72 million and $56 million; and in
our Other segment of $18 million, $9 million and $6 million for the years ended December 31, 2014, 2013 and 2012,
respectively.
The following table is a reconciliation of our Adjusted EBITDA to net income, the most directly comparable financial measure
calculated and presented in accordance with GAAP, for the periods presented:
Year ended December 31,
2014 2013 2012
(in millions)
Adjusted EBITDA ................................................................ $ 468 $ 379 $ 352
Depreciation (1) ...................................................................... (47) (30 ) (20)
OIBA (2) ................................................................................. 421 349 332
Amortization of intangible assets ........................................... (18) (6 ) (6)
Stock-based compensation ..................................................... (63) (49 ) (30)
Other expense, net .................................................................. (18) (10 ) (14)
Provision for income taxes ..................................................... (96) (79 ) (87)
Net income ............................................................................. $ 226 $ 205 $ 195
(1) Includes amortization of internal use software and website development costs.
(2) We define OIBA as net income (loss) plus: (1) provision for income taxes; (2) other income (expense), net; (3) stock-based compensation;
(4) amortization of intangible assets; and (5) non-recurring expenses. This operating metric is only used by our management to calculate our
annual obligation for our charitable foundation. Refer to “Note 12— Commitments and Contingencies” for a discussion of our charitable
foundation.