TripAdvisor 2014 Annual Report Download - page 49
Download and view the complete annual report
Please find page 49 of the 2014 TripAdvisor annual report below. You can navigate through the pages in the report by either clicking on the pages listed below, or by using the keyword search tool below to find specific information within the annual report.-
 1
1 -
2
-
3
-
4
-
5
-
6
-
7
-
8
-
9
-
10
-
11
-
12
-
13
-
14
-
15
-
16
-
17
-
18
-
19
-
20
-
21
-
22
-
23
-
24
-
25
-
26
-
27
-
28
-
29
-
30
-
31
-
32
-
33
-
34
-
35
-
36
-
37
-
38
-
 39
39 -
 40
40 -
 41
41 -
 42
42 -
 43
43 -
 44
44 -
 45
45 -
 46
46 -
 47
47 -
 48
48 -
 49
49 -
 50
50 -
 51
51 -
 52
52 -
 53
53 -
 54
54 -
 55
55 -
 56
56 -
 57
57 -
 58
58 -
 59
59 -
60
-
61
-
62
-
63
-
64
-
65
-
66
-
67
-
68
-
69
-
70
-
71
-
72
-
73
-
74
-
75
-
76
-
77
-
78
-
79
-
80
-
81
-
82
-
83
-
84
-
85
-
86
-
87
-
88
-
89
-
90
-
91
-
92
-
93
-
94
-
95
-
96
-
97
-
98
-
99
-
100
-
101
-
102
-
103
-
104
-
105
-
106
-
107
-
108
-
109
-
110
-
111
-
112
-
113
-
114
-
115
-
116
-
117
-
118
-
119
-
120
-
121
-
122
-
123
-
124
-
125
-
126
-
127
-
128
-
129
-
130
-
131
-
132
-
133
-
134
-
135
-
136
-
137
-
138
-
139
-
140
-
141
-
142
-
143
-
144
-
145
-
146
-
147
-
148
-
149
-
150
-
151
-
152
-
153
-
154
-
155
-
156
-
157
-
158
-
159
-
160
-
161
-
162
-
163
-
164
-
165
-
166
-
167
-
168
-
169
-
170
-
171
-
172
 |
 |

39
2014 vs. 2013
Cost of revenue increased $22 million during the year ended December 31, 2014, respectively, when compared to the same
periods in 2013, primarily due to increased data center costs, driven by higher site traffic; increased merchant credit card and
transaction fees, driven by additional transaction costs from our recent business acquisitions and free-to-list growth in our Vacation
Rental business; and customer support costs. In total, our restaurant and attraction businesses contributed $6 million to our cost of
revenue in 2014, of which $3 million related to personnel and overhead.
2013 vs. 2012
Cost of revenue increased $6 million during the year ended December 31, 2013 when compared to the same period in 2012,
primarily due to increased data center costs, driven by higher site traffic and merchant credit card fees.
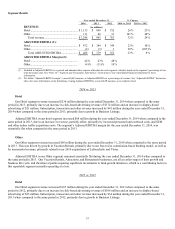
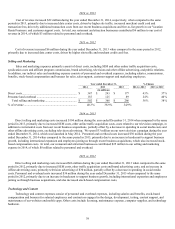
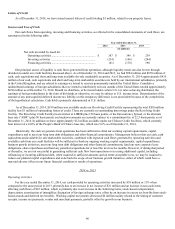
Selling and Marketing
Sales and marketing expenses primarily consist of direct costs, including SEM and other online traffic acquisition costs,
syndication costs and affiliate program commissions, brand advertising, television and other offline advertising, and public relations.
In addition, our indirect sales and marketing expense consists of personnel and overhead expenses, including salaries, commissions,
benefits, stock-based compensation and bonuses for sales, sales support, customer support and marketing employees.
Year ended December 31, % Change
2014 2013 2012 2014 vs 2013 2013 vs 2012
(in millions)
Direct costs .......................................................................... $ 347 $ 243 $ 177 43% 37%
Personnel and overhead ...................................................... 155 125 89 24% 40%
Total selling and marketing ........................................... $ 502 $ 368 $ 266 36% 38%
% of revenue ....................................................................... 40.3% 38.9% 34.9 %
2014 vs. 2013
Direct selling and marketing costs increased $104 million during the year ended December 31, 2014 when compared to the same
period in 2013, primarily due to increased SEM costs, other online traffic acquisition costs, costs related to our television campaign, in
addition to incremental costs from our recent business acquisitions, partially offset by a decrease in spending in social media costs and
other offline advertising costs, excluding television advertising. We spent $33 million on our new television campaign during the year
ended December 31, 2014, which was launched in May 2014. Personnel and overhead costs increased $30 million during the year
ended December 31, 2014 when compared to the same period in 2013, primarily due to an increase in headcount to support business
growth, including international expansion and employees joining us through recent business acquisitions, which also increased stock-
based compensation costs. In total, our restaurant and attraction businesses contributed $25 million to our selling and marketing
expense in 2014, of which $8 million related to personnel and overhead.
2013 vs. 2012
Direct selling and marketing costs increased $66 million during the year ended December 31, 2013 when compared to the same
period in 2012, primarily due to increased SEM costs, other traffic acquisition costs and brand advertising costs, and an increase in
offline advertising costs, primarily television advertising of $30 million, partially offset by a decrease in spending in social media
costs. Personnel and overhead costs increased $36 million during the year ended December 31, 2013 when compared to the same
period in 2012, primarily due to an increase in headcount to support business growth, including international expansion and employees
joining us through business acquisitions, and also increased stock-based compensation costs.
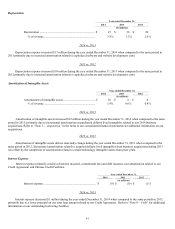
Technology and Content
Technology and content expenses consist of personnel and overhead expenses, including salaries and benefits, stock-based
compensation and bonuses for salaried employees and contractors engaged in the design, development, testing, content support, and
maintenance of our websites and mobile apps. Other costs include licensing, maintenance expense, computer supplies, and technology
hardware.