TripAdvisor 2014 Annual Report Download - page 104
Download and view the complete annual report
Please find page 104 of the 2014 TripAdvisor annual report below. You can navigate through the pages in the report by either clicking on the pages listed below, or by using the keyword search tool below to find specific information within the annual report.-
 1
1 -
2
-
3
-
4
-
5
-
6
-
7
-
8
-
9
-
10
-
11
-
12
-
13
-
14
-
15
-
16
-
17
-
18
-
19
-
20
-
21
-
22
-
23
-
24
-
25
-
26
-
27
-
28
-
29
-
30
-
31
-
32
-
33
-
34
-
35
-
36
-
37
-
38
-
39
-
40
-
41
-
42
-
43
-
44
-
45
-
46
-
47
-
48
-
49
-
50
-
51
-
52
-
53
-
54
-
55
-
56
-
57
-
58
-
59
-
60
-
61
-
62
-
63
-
64
-
65
-
66
-
67
-
68
-
69
-
70
-
71
-
72
-
73
-
74
-
75
-
76
-
77
-
78
-
79
-
80
-
81
-
82
-
83
-
84
-
85
-
86
-
87
-
88
-
89
-
90
-
91
-
92
-
93
-
 94
94 -
 95
95 -
 96
96 -
 97
97 -
 98
98 -
 99
99 -
 100
100 -
 101
101 -
 102
102 -
 103
103 -
 104
104 -
 105
105 -
 106
106 -
 107
107 -
 108
108 -
 109
109 -
 110
110 -
 111
111 -
 112
112 -
 113
113 -
 114
114 -
115
-
116
-
117
-
118
-
119
-
120
-
121
-
122
-
123
-
124
-
125
-
126
-
127
-
128
-
129
-
130
-
131
-
132
-
133
-
134
-
135
-
136
-
137
-
138
-
139
-
140
-
141
-
142
-
143
-
144
-
145
-
146
-
147
-
148
-
149
-
150
-
151
-
152
-
153
-
154
-
155
-
156
-
157
-
158
-
159
-
160
-
161
-
162
-
163
-
164
-
165
-
166
-
167
-
168
-
169
-
170
-
171
-
172
 |
 |

94
Hotel
Our Hotel segment includes revenue generated from services related to hotels, including click-based and display-based
advertising revenue from making hotel room nights, airline reservations, and cruise reservations available for price comparison and
booking, as well as subscription-based products such as Business Listings, transaction-based products such as Jetsetter and Tingo, and
other revenue related to hotels. Our CODM is also the Hotel segment manager.
Other
Attractions. We provide, through Viator, information and services for researching and booking destination activities around the
world. Viator works with local operators to provide travelers with access to tours and activities in popular destinations worldwide,
earning a commission for such service. In addition to its consumer-direct business, Viator also provides local experiences to affiliate
partners, including some of the world’s top airlines, hotels and travel agencies.
Restaurants. This business is comprised of our websites that provide online and mobile reservation services that connect
restaurants with diners. These websites are currently focused on the European market, primarily through Lafourchette. Lafourchette
is an online restaurant booking platform with a network of restaurant partners across Europe. Lafourchette also offers management
software solutions helping restaurants to maximize business by providing a flexible online booking, discount and data tool. Revenue is
primarily generated by receiving a fee for each restaurant guest seated through the online reservation systems.
Vacation Rentals. We offer individual property owners and property managers the ability to list their properties available for
rental and connect with travelers using a subscription-based fee structure or a free-to-list, commission per booking based option. Our
vacation rental inventory currently includes full home rentals, condos, villas, beach rentals, cabins, cottages, and many other
accommodation types. These properties are listed across a number of platforms, including TripAdvisor Vacation Rentals, U.S.-based
FlipKey (which includes Vacation Home Rentals acquired during 2014), and European-based Holiday Lettings and Niumba.
Each operating segment in our Other segment has a segment manager who is directly accountable to and maintains regular
contact with our chief operating decision maker to discuss operating activities, financial results, forecasts, and plans for the segment.
Our primary operating metric for evaluating segment performance is Adjusted EBITDA, which is a non-GAAP financial
measure. We define Adjusted EBITDA as net income (loss) plus: (1) provision for income taxes; (2) other income (expense), net;
(3) depreciation of property and equipment, including amortization of internal use software and website development; (4) amortization
of intangible assets; (5) stock-based compensation; and (6) non-recurring expenses. Such amounts are detailed in our segment
reconciliation below. In addition, please see our discussion of Adjusted EBITDA in the section of this Annual Report on Form 10-K
entitled “Management’s Discussion and Analysis of Financial Condition and Results of Operations.”
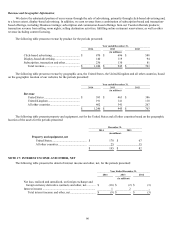
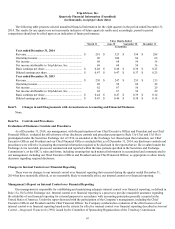
The following tables present our segment information for the years ended December 31, 2014, 2013 and 2012. We record
depreciation of property and equipment, including amortization of internal-use software and website development, amortization of
intangible assets, stock-based compensation, other expense, net, other non-recurring expenses, net, and income taxes, which are
excluded from segment operating performance, in Corporate and unallocated. In addition, we do not report our assets or capital
expenditures by segment as it would not be meaningful. We also do not regularly provide asset, capital expenditure or depreciation
information by segment to our CODM. Our consolidated general and administrative expenses, excluding stock-based compensation
costs, are shared by all operating segments. Each operating segment receives an allocated charge based on the segment’s percentage
of the Company’s total personnel costs.
Year ended December 31, 2014
Hotel Other Corporate and
unallocated Total
(in millions)
Revenue ............................................................. $1,135 $ 111 $ — $ 1,246
Adjusted EBITDA (1) ....................................... 472 (4) — 468
Depreciation ...................................................... — — (47 ) (47)
Amortization of intangible assets ...................... — — (18 ) (18)
Stock-based compensation ................................ — — (63 ) (63)
Operating income (loss) .................................... $472 $ (4) $ (128 ) 340
Other expense, net ............................................. (18)
Income before income taxes .............................. 322
Provision for income taxes ................................ (96)
N
et income ........................................................ 226