TripAdvisor 2014 Annual Report Download - page 44
Download and view the complete annual report
Please find page 44 of the 2014 TripAdvisor annual report below. You can navigate through the pages in the report by either clicking on the pages listed below, or by using the keyword search tool below to find specific information within the annual report.-
 1
1 -
2
-
3
-
4
-
5
-
6
-
7
-
8
-
9
-
10
-
11
-
12
-
13
-
14
-
15
-
16
-
17
-
18
-
19
-
20
-
21
-
22
-
23
-
24
-
25
-
26
-
27
-
28
-
29
-
30
-
31
-
32
-
33
-
 34
34 -
 35
35 -
 36
36 -
 37
37 -
 38
38 -
 39
39 -
 40
40 -
 41
41 -
 42
42 -
 43
43 -
 44
44 -
 45
45 -
 46
46 -
 47
47 -
 48
48 -
 49
49 -
 50
50 -
 51
51 -
 52
52 -
 53
53 -
 54
54 -
55
-
56
-
57
-
58
-
59
-
60
-
61
-
62
-
63
-
64
-
65
-
66
-
67
-
68
-
69
-
70
-
71
-
72
-
73
-
74
-
75
-
76
-
77
-
78
-
79
-
80
-
81
-
82
-
83
-
84
-
85
-
86
-
87
-
88
-
89
-
90
-
91
-
92
-
93
-
94
-
95
-
96
-
97
-
98
-
99
-
100
-
101
-
102
-
103
-
104
-
105
-
106
-
107
-
108
-
109
-
110
-
111
-
112
-
113
-
114
-
115
-
116
-
117
-
118
-
119
-
120
-
121
-
122
-
123
-
124
-
125
-
126
-
127
-
128
-
129
-
130
-
131
-
132
-
133
-
134
-
135
-
136
-
137
-
138
-
139
-
140
-
141
-
142
-
143
-
144
-
145
-
146
-
147
-
148
-
149
-
150
-
151
-
152
-
153
-
154
-
155
-
156
-
157
-
158
-
159
-
160
-
161
-
162
-
163
-
164
-
165
-
166
-
167
-
168
-
169
-
170
-
171
-
172
 |
 |

34
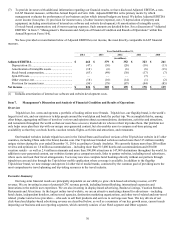
Results of Operations
Selected Financial Data
(in millions, except per share data)
Year ended December 31, % Change
2014 2013 2012
2014 vs. 2013 2013 vs. 2012
Revenue............................................................................... $1,246 $945 $763 32% 24%
Costs and expenses:
Cost of revenue (exclusive of amortization) (1) ............ 40 18 12 122% 50%
Selling and marketing (2) .............................................. 502 368 266 36% 38%
Technology and content (2) ........................................... 171 131 87 31% 51%
General and administrative (2) ...................................... 128 98 76 31% 29%
Depreciation .................................................................. 47 30 20 57% 50%
Amortization of intangible assets .................................. 18 6 6 200% 0%
Total costs and expenses ..................................................... 906 651 467 39% 39%
Operating income ................................................................ 340 294 296 16% (1)%
Other income (expense):
Interest expense ............................................................. (9) (10) (11 )
(10)% (9)%
Interest income and other, net ........................................ (9) - (3 )
100% (100)%
Total other expense, net ...................................................... (18) (10) (14 )
80% (29)%
Income before income taxes ................................................ 322 284 282 13% 1%
Provision for income taxes .................................................. (96) (79) (87 )
22% (9)%
N
et income .......................................................................... 226 205 195 10% 5%
N
et (income) loss attributable to noncontrolling interes
t
.... - - (1 )
0% (100)%
N
et income attributable to TripAdvisor, Inc. ...................... $226 $205 $194 10% 6%
Earnings per share attributable to TripAdvisor, Inc.
available to common stockholders:
Basic .............................................................................. $1.58 $1.44 $1.39 10% 4%
Diluted ........................................................................... $1.55 $1.41 $1.37 10% 3%
Weighted average common shares outstanding:
Basic .............................................................................. 143 143 139 0% 3%
Diluted ........................................................................... 146 145 141 1% 3%
Other financial data:
Adjusted EBITDA (3) ......................................................... $468 $379 $352 23% 8%
(1) Excludes amortization as follows:
Amortization of acquired technology included in
amortization of intangibles ......................................... $ 4 $ 1 $1
Amortization of website development costs
included in depreciation .............................................. 30 20 13
$34 $21 $14
(2) Includes stock-based compensation expense as
follows:
Selling and marketing .................................................... $13 $11 $5
Technology and content ................................................. 27 21 11
General and administrative ............................................ 23 17 14
(3) See “Adjusted EBITDA” discussion below for more information and for a reconciliation of Adjusted EBITDA to net income,
the most directly comparable financial measure calculated and presented in accordance with GAAP.