TripAdvisor 2014 Annual Report Download - page 51
Download and view the complete annual report
Please find page 51 of the 2014 TripAdvisor annual report below. You can navigate through the pages in the report by either clicking on the pages listed below, or by using the keyword search tool below to find specific information within the annual report.-
 1
1 -
2
-
3
-
4
-
5
-
6
-
7
-
8
-
9
-
10
-
11
-
12
-
13
-
14
-
15
-
16
-
17
-
18
-
19
-
20
-
21
-
22
-
23
-
24
-
25
-
26
-
27
-
28
-
29
-
30
-
31
-
32
-
33
-
34
-
35
-
36
-
37
-
38
-
39
-
40
-
 41
41 -
 42
42 -
 43
43 -
 44
44 -
 45
45 -
 46
46 -
 47
47 -
 48
48 -
 49
49 -
 50
50 -
 51
51 -
 52
52 -
 53
53 -
 54
54 -
 55
55 -
 56
56 -
 57
57 -
 58
58 -
 59
59 -
 60
60 -
 61
61 -
62
-
63
-
64
-
65
-
66
-
67
-
68
-
69
-
70
-
71
-
72
-
73
-
74
-
75
-
76
-
77
-
78
-
79
-
80
-
81
-
82
-
83
-
84
-
85
-
86
-
87
-
88
-
89
-
90
-
91
-
92
-
93
-
94
-
95
-
96
-
97
-
98
-
99
-
100
-
101
-
102
-
103
-
104
-
105
-
106
-
107
-
108
-
109
-
110
-
111
-
112
-
113
-
114
-
115
-
116
-
117
-
118
-
119
-
120
-
121
-
122
-
123
-
124
-
125
-
126
-
127
-
128
-
129
-
130
-
131
-
132
-
133
-
134
-
135
-
136
-
137
-
138
-
139
-
140
-
141
-
142
-
143
-
144
-
145
-
146
-
147
-
148
-
149
-
150
-
151
-
152
-
153
-
154
-
155
-
156
-
157
-
158
-
159
-
160
-
161
-
162
-
163
-
164
-
165
-
166
-
167
-
168
-
169
-
170
-
171
-
172
 |
 |

41
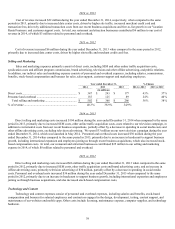
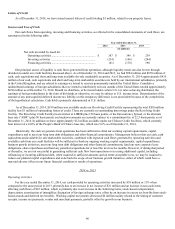
Depreciation
Year ended December 31,
2014 2013 2012
(in millions)
Depreciation .......................................................................... $47 $30 $ 20
% of revenue .................................................................... 3.8% 3.2 % 2.6%
2014 vs. 2013
Depreciation expense increased $17 million during the year ended December 31, 2014 when compared to the same period in
2013 primarily due to increased amortization related to capitalized software and website development costs.
2013 vs. 2012
Depreciation expense increased $10 million during the year ended December 31, 2013 when compared to the same period in
2012 primarily due to increased amortization related to capitalized software and website development costs.
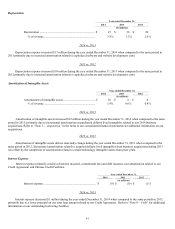
Amortization of Intangible Assets
Year ended December 31,
2014 2013 2012
(in millions)
Amortization of intangible assets ........................................... $18 $6 $ 6
% of revenue ..................................................................... 1.4% 0.6 % 0.8%
2014 vs. 2013
Amortization of intangible assets increased $12 million during the year ended December 31, 2014 when compared to the same
period in 2013, primarily due to incremental amortization on purchased definite lived intangibles related to our 2014 business
acquisitions. Refer to “Note 3— Acquisition” in the notes to our consolidated financial statements for additional information on our
acquisitions.
2013 vs. 2012
Amortization of intangible assets did not materially change during the year ended December 31, 2013 when compared to the
same period in 2012. Incremental amortization related to acquired definite lived intangibles from business acquisitions during 2013
was offset by the completion of amortization related to certain technology intangible assets from prior years.
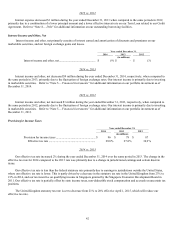
Interest Expense
Interest expense primarily consists of interest incurred, commitment fees and debt issuance cost amortization related to our
Credit Agreement and Chinese Credit Facilities.
Year ended December 31,
2014 2013 2012
(in millions)
Interest expense ...................................................................... $ (9) $ (10 ) $ (11)
2014 vs. 2013
Interest expense decreased $1 million during the year ended December 31, 2014 when compared to the same periods in 2013,
primarily due to a lower principal on our term loan amount related to our Credit Agreement. Refer to “Note 8— Debt” for additional
information on our outstanding borrowing facilities.