TripAdvisor 2014 Annual Report Download - page 106
Download and view the complete annual report
Please find page 106 of the 2014 TripAdvisor annual report below. You can navigate through the pages in the report by either clicking on the pages listed below, or by using the keyword search tool below to find specific information within the annual report.-
 1
1 -
2
-
3
-
4
-
5
-
6
-
7
-
8
-
9
-
10
-
11
-
12
-
13
-
14
-
15
-
16
-
17
-
18
-
19
-
20
-
21
-
22
-
23
-
24
-
25
-
26
-
27
-
28
-
29
-
30
-
31
-
32
-
33
-
34
-
35
-
36
-
37
-
38
-
39
-
40
-
41
-
42
-
43
-
44
-
45
-
46
-
47
-
48
-
49
-
50
-
51
-
52
-
53
-
54
-
55
-
56
-
57
-
58
-
59
-
60
-
61
-
62
-
63
-
64
-
65
-
66
-
67
-
68
-
69
-
70
-
71
-
72
-
73
-
74
-
75
-
76
-
77
-
78
-
79
-
80
-
81
-
82
-
83
-
84
-
85
-
86
-
87
-
88
-
89
-
90
-
91
-
92
-
93
-
94
-
95
-
 96
96 -
 97
97 -
 98
98 -
 99
99 -
 100
100 -
 101
101 -
 102
102 -
 103
103 -
 104
104 -
 105
105 -
 106
106 -
 107
107 -
 108
108 -
 109
109 -
 110
110 -
 111
111 -
 112
112 -
 113
113 -
 114
114 -
 115
115 -
 116
116 -
117
-
118
-
119
-
120
-
121
-
122
-
123
-
124
-
125
-
126
-
127
-
128
-
129
-
130
-
131
-
132
-
133
-
134
-
135
-
136
-
137
-
138
-
139
-
140
-
141
-
142
-
143
-
144
-
145
-
146
-
147
-
148
-
149
-
150
-
151
-
152
-
153
-
154
-
155
-
156
-
157
-
158
-
159
-
160
-
161
-
162
-
163
-
164
-
165
-
166
-
167
-
168
-
169
-
170
-
171
-
172
 |
 |

96
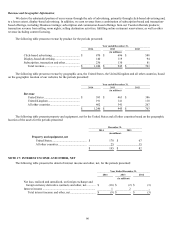
Revenue and Geographic Information
We derive the substantial portion of our revenue through the sale of advertising, primarily through click-based advertising and,
to a lesser extent, display-based advertising. In addition, we earn revenue from a combination of subscription-based and transaction-
based offerings, including: Business Listings; subscription and commission-based offerings from our Vacation Rentals products;
transaction revenue from selling room nights; selling destination activities; fulfilling online restaurant reservations; as well as other
revenue including content licensing.
The following table presents revenue by product for the periods presented:
Year ended December 31,
2014 2013 2012
(in millions)
Click-based advertising ..................................... $870 $696 $ 588
Display-based advertising .................................. 140 119 94
Subscription, transaction and other .................... 236 130 81
Total revenue ................................................ $1,246 $945 $ 763
The following table presents revenue by geographic area, the United States, the United Kingdom and all other countries, based
on the geographic location of our websites for the periods presented:
Year ended December 31,
2014 2013 2012
(in millions)
Revenue
United States ................................................ $593 $463 $ 386
United Kingdom ........................................... 191 141 110
All other countries ........................................ 462 341 267
$1,246 $945 $ 763
The following table presents property and equipment, net for the United States and all other countries based on the geographic
location of the assets for the periods presented:
December 31,
2014 2013
(in millions)
Property and equipment, net
United States............................................... $170 $ 67
All other countries ...................................... 25 15
$195 $ 82
NOTE 17: INTEREST INCOME AND OTHER, NET
The following table presents the detail of interest income and other, net, for the periods presented:
Year Ended December 31,
2014 2013 2012
(in millions)
N
et loss, realized and unrealized, on foreign exchange an
d
foreign currency derivative contracts and other, net ............ $(10) $ (2 ) $ (3)
Interest income ....................................................................... 1 2 -
Total interest income and other, net .................................. $ (9) $ - $ (3)