TripAdvisor 2014 Annual Report Download - page 48
Download and view the complete annual report
Please find page 48 of the 2014 TripAdvisor annual report below. You can navigate through the pages in the report by either clicking on the pages listed below, or by using the keyword search tool below to find specific information within the annual report.-
 1
1 -
2
-
3
-
4
-
5
-
6
-
7
-
8
-
9
-
10
-
11
-
12
-
13
-
14
-
15
-
16
-
17
-
18
-
19
-
20
-
21
-
22
-
23
-
24
-
25
-
26
-
27
-
28
-
29
-
30
-
31
-
32
-
33
-
34
-
35
-
36
-
37
-
 38
38 -
 39
39 -
 40
40 -
 41
41 -
 42
42 -
 43
43 -
 44
44 -
 45
45 -
 46
46 -
 47
47 -
 48
48 -
 49
49 -
 50
50 -
 51
51 -
 52
52 -
 53
53 -
 54
54 -
 55
55 -
 56
56 -
 57
57 -
 58
58 -
59
-
60
-
61
-
62
-
63
-
64
-
65
-
66
-
67
-
68
-
69
-
70
-
71
-
72
-
73
-
74
-
75
-
76
-
77
-
78
-
79
-
80
-
81
-
82
-
83
-
84
-
85
-
86
-
87
-
88
-
89
-
90
-
91
-
92
-
93
-
94
-
95
-
96
-
97
-
98
-
99
-
100
-
101
-
102
-
103
-
104
-
105
-
106
-
107
-
108
-
109
-
110
-
111
-
112
-
113
-
114
-
115
-
116
-
117
-
118
-
119
-
120
-
121
-
122
-
123
-
124
-
125
-
126
-
127
-
128
-
129
-
130
-
131
-
132
-
133
-
134
-
135
-
136
-
137
-
138
-
139
-
140
-
141
-
142
-
143
-
144
-
145
-
146
-
147
-
148
-
149
-
150
-
151
-
152
-
153
-
154
-
155
-
156
-
157
-
158
-
159
-
160
-
161
-
162
-
163
-
164
-
165
-
166
-
167
-
168
-
169
-
170
-
171
-
172
 |
 |

38
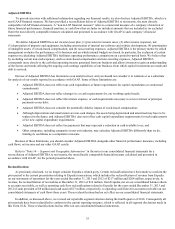
Adjusted EBITDA in our hotel segment increased $35 million during the year ended December 31, 2014 when compared to the
same period in 2013, due to an increase in revenue, partially offset, primarily by increased personnel and overhead costs, SEM and
other online traffic acquisition costs, and costs incurred for our 2013 television advertising campaign, offset by a decrease in social
media costs. The segment’s Adjusted EBITDA margin for the year ended December 31, 2013, decreased by 5% when compared to the
same period in 2012.
Other
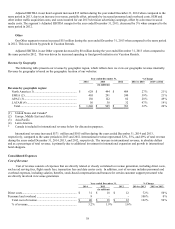
Our Other segment revenue increased $15 million during the year ended December 31, 2013 when compared to the same period
in 2012. This was driven by growth in Vacation Rentals.
Adjusted EBITDA in our Other segment decreased by $8 million during the year ended December 31, 2013 when compared to
the same period in 2012. This was driven by increased spending to fund growth initiatives in Vacation Rentals.
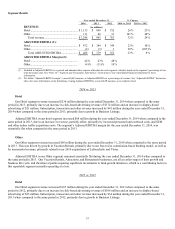
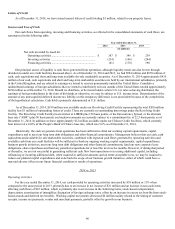
Revenue by Geography
The following table presents our revenue by geographic region, which reflects how we view our geographic revenue internally.
Revenue by geography is based on the geographic location of our websites:
Year ended December 31, % Change
2014 2013 2012 2014 vs 2013 2013 vs 2012
(in millions)
Revenue by geographic region:
North America (1) ......................................................... $ 629 $ 494 $ 409 27% 21%
EMEA (2) ...................................................................... 405 291 240 39% 21%
APAC (3) ....................................................................... 156 122 82 28% 49%
LATAM (4) ................................................................... 56 38 32 47% 19%
Total ............................................................................ $ 1,246 $ 945 $ 763 32% 24%
(1) United States and Canada*
(2) Europe, Middle East and Africa
(3) Asia-Pacific
(4) Latin America
* Canada is included in international revenue below for discussion purposes.
International revenue increased $171 million and $105 million during the years ended December 31, 2014 and 2013,
respectively, compared to the same periods in 2013 and 2012. International revenue represented 52%, 51%, and 49% of total revenue
during the years ended December 31, 2014, 2013, and 2012, respectively. The increase in international revenue, in absolute dollars
and as a percentage of total revenue, is primarily due to additional investment in international expansion and growth in international
hotel shoppers.
Consolidated Expenses
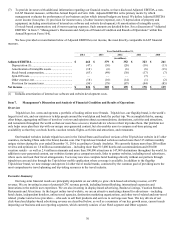
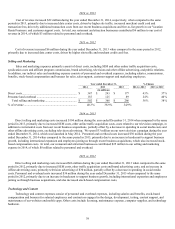
Cost of Revenue
Cost of revenue consists of expenses that are directly related or closely correlated to revenue generation, including direct costs,
such as ad serving fees, flight search fees, transaction fees and data center costs. In addition, cost of revenue includes personnel and
overhead expenses, including salaries, benefits, stock-based compensation and bonuses for certain customer support personnel who
are directly involved in revenue generation.
Year ended December 31, % Change
2014 2013 2012 2014 vs 2013 2013 vs 2012
(in millions)
Direct costs .......................................................................... $31 $ 18 $ 12 72% 50%
Personnel and overhead ...................................................... 9 - - 100% 0%
Total cost of revenue ..................................................... $ 40 $ 18 $ 12 122% 50%
% of revenue .................................................................. 3.2% 1.9% 1.6 %