TripAdvisor 2014 Annual Report Download - page 46
Download and view the complete annual report
Please find page 46 of the 2014 TripAdvisor annual report below. You can navigate through the pages in the report by either clicking on the pages listed below, or by using the keyword search tool below to find specific information within the annual report.-
 1
1 -
2
-
3
-
4
-
5
-
6
-
7
-
8
-
9
-
10
-
11
-
12
-
13
-
14
-
15
-
16
-
17
-
18
-
19
-
20
-
21
-
22
-
23
-
24
-
25
-
26
-
27
-
28
-
29
-
30
-
31
-
32
-
33
-
34
-
35
-
 36
36 -
 37
37 -
 38
38 -
 39
39 -
 40
40 -
 41
41 -
 42
42 -
 43
43 -
 44
44 -
 45
45 -
 46
46 -
 47
47 -
 48
48 -
 49
49 -
 50
50 -
 51
51 -
 52
52 -
 53
53 -
 54
54 -
 55
55 -
 56
56 -
57
-
58
-
59
-
60
-
61
-
62
-
63
-
64
-
65
-
66
-
67
-
68
-
69
-
70
-
71
-
72
-
73
-
74
-
75
-
76
-
77
-
78
-
79
-
80
-
81
-
82
-
83
-
84
-
85
-
86
-
87
-
88
-
89
-
90
-
91
-
92
-
93
-
94
-
95
-
96
-
97
-
98
-
99
-
100
-
101
-
102
-
103
-
104
-
105
-
106
-
107
-
108
-
109
-
110
-
111
-
112
-
113
-
114
-
115
-
116
-
117
-
118
-
119
-
120
-
121
-
122
-
123
-
124
-
125
-
126
-
127
-
128
-
129
-
130
-
131
-
132
-
133
-
134
-
135
-
136
-
137
-
138
-
139
-
140
-
141
-
142
-
143
-
144
-
145
-
146
-
147
-
148
-
149
-
150
-
151
-
152
-
153
-
154
-
155
-
156
-
157
-
158
-
159
-
160
-
161
-
162
-
163
-
164
-
165
-
166
-
167
-
168
-
169
-
170
-
171
-
172
 |
 |

36
All other reclassifications, made to conform the prior periods to the current presentation, were not material and had no net effect
on our consolidated financial statements.
Consolidated Revenue and Segments
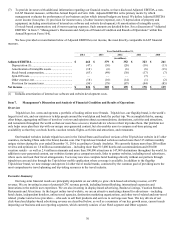
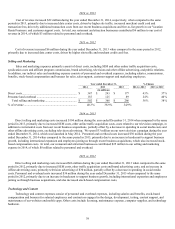
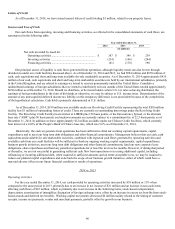
Revenue by Product
We derive the substantial portion of our revenue through the sale of advertising, primarily through click-based advertising and,
to a lesser extent, display-based advertising. In addition, we earn revenue from a combination of subscription-based and transaction-
based offerings, including: Business Listings; subscription and commission-based offerings from our Vacation Rentals products;
transaction revenue from selling room nights through our Jetsetter and Tingo brands; selling destination activities from newly-
acquired Viator; fulfilling online restaurant reservations through Lafourchette; as well as other revenue including content licensing.
Year ended December 31, % Change
2014 2013 2012
2014 vs
2013
2013 vs
2012
(in millions)
Click-based advertising .................................... $ 870 $ 696 $ 588 25 % 18%
Display-based advertising ................................. 140 119 94 18 % 27%
Subscription, transaction and other* ................. 236 130 81 82 % 60%
Total revenue ............................................... $ 1,246 $ 945 $ 763 32 % 24%
* Substantially all revenue reported in our Other segment is from our subscription, transaction and other products.
2014 vs. 2013
Revenue increased $301 million during the year ended December 31, 2014 when compared to the same period in 2013,
primarily due to an increase in click-based advertising revenue of $174 million. The primary driver of the increase in click-based
advertising revenue was an increase in hotel shoppers of 17% and an increase in revenue per hotel shopper of 7% for the year ended
December 31, 2014. Display-based advertising increased by $21 million during the year ended December 31, 2014, primarily as a
result of a 19% increase in the number of impressions sold when compared to the same period in 2013, primarily due to increased
sales productivity, ad tech improvements that have enhanced marketers ability to target, coupled with worldwide growth particularly
in emerging markets, partially offset by a decrease in pricing by 1% for the same period. Subscription, transaction and other revenue
increased by $106 million during the year ended December 31, 2014, primarily due to growth in our Business Listings and Vacation
Rentals products, as well as revenue generated by the businesses we acquired during 2014 of $43 million.
2013 vs. 2012
Revenue increased $182 million during the year ended December 31, 2013 when compared to the same period in 2012,
primarily due to an increase in click-based advertising revenue of $108 million. The primary driver of the increase in click-based
advertising revenue was an increase in hotel shoppers of 35% for the year ended December 31, 2013, partially offset by lower revenue
per hotel shopper of 13% for the year ended December 31, 2013, primarily due to a combination of lower user conversion related to
our transition to hotel metasearch, growth in hotel shoppers on smartphones, which have a lower monetization rate than desktops and
tablets, and growth in emerging international markets that are currently monetizing at lower levels than our mature markets. Display-
based advertising increased by $25 million during the year ended December 31, 2013, primarily as a result of a 34% increase in the
number of impressions sold due to increased sales productivity coupled with our new Delayed Ad Call product, and worldwide growth
particularly in emerging markets when compared to the same period in 2013, partially offset by a decrease in pricing by 5% for the
year ended December 31, 2013. Subscription, transaction and other revenue increased by $49 million during the year ended
December 31, 2013, primarily due to growth in our Business Listings and Vacation Rentals products.