Travelers 2014 Annual Report Download - page 99
Download and view the complete annual report
Please find page 99 of the 2014 Travelers annual report below. You can navigate through the pages in the report by either clicking on the pages listed below, or by using the keyword search tool below to find specific information within the annual report.-
 1
1 -
2
-
3
-
4
-
5
-
6
-
7
-
8
-
9
-
10
-
11
-
12
-
13
-
14
-
15
-
16
-
17
-
18
-
19
-
20
-
21
-
22
-
23
-
24
-
25
-
26
-
27
-
28
-
29
-
30
-
31
-
32
-
33
-
34
-
35
-
36
-
37
-
38
-
39
-
40
-
41
-
42
-
43
-
44
-
45
-
46
-
47
-
48
-
49
-
50
-
51
-
52
-
53
-
54
-
55
-
56
-
57
-
58
-
59
-
60
-
61
-
62
-
63
-
64
-
65
-
66
-
67
-
68
-
69
-
70
-
71
-
72
-
73
-
74
-
75
-
76
-
77
-
78
-
79
-
80
-
81
-
82
-
83
-
84
-
85
-
86
-
87
-
88
-
 89
89 -
 90
90 -
 91
91 -
 92
92 -
 93
93 -
 94
94 -
 95
95 -
 96
96 -
 97
97 -
 98
98 -
 99
99 -
 100
100 -
 101
101 -
 102
102 -
 103
103 -
 104
104 -
 105
105 -
 106
106 -
 107
107 -
 108
108 -
 109
109 -
110
-
111
-
112
-
113
-
114
-
115
-
116
-
117
-
118
-
119
-
120
-
121
-
122
-
123
-
124
-
125
-
126
-
127
-
128
-
129
-
130
-
131
-
132
-
133
-
134
-
135
-
136
-
137
-
138
-
139
-
140
-
141
-
142
-
143
-
144
-
145
-
146
-
147
-
148
-
149
-
150
-
151
-
152
-
153
-
154
-
155
-
156
-
157
-
158
-
159
-
160
-
161
-
162
-
163
-
164
-
165
-
166
-
167
-
168
-
169
-
170
-
171
-
172
-
173
-
174
-
175
-
176
-
177
-
178
-
179
-
180
-
181
-
182
-
183
-
184
-
185
-
186
-
187
-
188
-
189
-
190
-
191
-
192
-
193
-
194
-
195
-
196
-
197
-
198
-
199
-
200
-
201
-
202
-
203
-
204
-
205
-
206
-
207
-
208
-
209
-
210
-
211
-
212
-
213
-
214
-
215
-
216
-
217
-
218
-
219
-
220
-
221
-
222
-
223
-
224
-
225
-
226
-
227
-
228
-
229
-
230
-
231
-
232
-
233
-
234
-
235
-
236
-
237
-
238
-
239
-
240
-
241
-
242
-
243
-
244
-
245
-
246
-
247
-
248
-
249
-
250
-
251
-
252
-
253
-
254
-
255
-
256
-
257
-
258
-
259
-
260
-
261
-
262
-
263
-
264
-
265
-
266
-
267
-
268
-
269
-
270
-
271
-
272
-
273
-
274
-
275
-
276
-
277
-
278
-
279
-
280
-
281
-
282
-
283
-
284
-
285
-
286
-
287
-
288
-
289
-
290
-
291
-
292
-
293
-
294
-
295
-
296
-
297
-
298
-
299
-
300
-
301
-
302
-
303
-
304
-
305
-
306
-
307
-
308
-
309
-
310
-
311
-
312
-
313
-
314
-
315
-
316
-
317
-
318
-
319
-
320
-
321
-
322
-
323
-
324
-
325
-
326
-
327
-
328
-
329
-
330
-
331
-
332
-
333
-
334
-
335
-
336
-
337
-
338
-
339
-
340
-
341
-
342
-
343
-
344
-
345
-
346
-
347
-
348
-
349
-
350
-
351
-
352
-
353
-
354
-
355
-
356
-
357
-
358
-
359
-
360
-
361
-
362
-
363
-
364
-
365
-
366
 |
 |

Table of Contents
contributing to net favorable prior year reserve development are discussed in more detail in note 7 of notes to the Company's consolidated financial
statements.
Amortization of Deferred Acquisition Costs
Amortization of deferred acquisition costs in 2014 was $1.17 billion, $112 million or 9% lower than in 2013. The decrease in 2014 primarily
reflected a decline in commission expense due to lower commission rates, as well as a decline in earned premiums compared with 2013. Amortization
of deferred acquisition costs in 2013 was $1.29 billion, $152 million or 11% lower than in 2012. The decrease in 2013 reflected (i) the decline in earned
premiums compared with 2012, (ii) a reclassification of fee income related to the National Flood Insurance Program from general and administrative
expenses to a component of acquisition costs to conform to the presentation prescribed by insurance regulators, and (iii) lower fixed
-
value
commission expense due to an increase in the number of agents reverting to a contingent commission compensation program.
General and Administrative Expenses
General and administrative expenses in 2014 were $977 million, $3 million or less than 1% lower than in 2013. The decrease in 2014 primarily
reflected the impact of the Company's expense reduction initiatives, largely offset by higher contingent commission expenses and higher
underwriting expenses resulting from higher new business levels. General and administrative expenses in 2013 were $980 million, $80 million or 9%
higher than in 2012. The increase in 2013 included an increase in contingent commission expense due to an increase in the number of agents
reverting from a fixed
-
value commission compensation program to a contingent commission compensation program and the impact of the
reclassification of fee income described above. The increase in 2013 also included the impact of $12 million of restructuring charges, primarily
comprised of severance costs related to the Company's announced plan to reduce certain claim and other insurance expenses in this segment.
These factors were partially offset by a decline in advertising expense.
Income Tax Expense
Income tax expense in 2014 was $366 million, level with 2013, as the tax effect of the $14 million decrease in pre
-
tax operating income was offset
by the impact of a $5 million reduction in income tax expense in 2013 resulting from the resolution of prior year tax matters. Income tax expense in
2013 was $366 million, $334 million higher than in 2012, primarily reflecting the impacts of the $955 million increase in pre
-
tax operating income,
partially offset by a reduction in income tax expense resulting from the resolution of prior year tax matters in 2013.
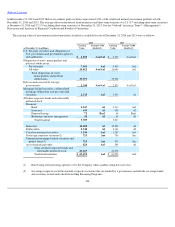
Combined Ratio
The combined ratio of 88.7% in 2014 was 0.2 points lower than the combined ratio of 88.9% in 2013.
The loss and loss adjustment expense ratio of 59.6% in 2014 was 0.5 points higher than the loss and loss adjustment expense ratio of 59.1% in
2013. Catastrophe losses in 2014 and 2013 accounted for 4.7 points and 3.4 points of the loss and loss adjustment expense ratios, respectively. Net
favorable prior year reserve development in 2014 and 2013 provided 2.4 points and 2.8 points of benefit, respectively, to the loss and loss
adjustment expense ratio. The 2014 underlying loss and loss adjustment expense ratio was 1.2 points lower than the 2013 ratio on the same basis,
primarily reflecting (i) earned pricing that exceeded loss cost trends and (ii) the benefit of the Company's previously announced expense reduction
initiatives, partially offset by (iii) the impact of a higher mix of new business versus renewal business.
98