Travelers 2014 Annual Report Download - page 282
Download and view the complete annual report
Please find page 282 of the 2014 Travelers annual report below. You can navigate through the pages in the report by either clicking on the pages listed below, or by using the keyword search tool below to find specific information within the annual report.-
 1
1 -
2
-
3
-
4
-
5
-
6
-
7
-
8
-
9
-
10
-
11
-
12
-
13
-
14
-
15
-
16
-
17
-
18
-
19
-
20
-
21
-
22
-
23
-
24
-
25
-
26
-
27
-
28
-
29
-
30
-
31
-
32
-
33
-
34
-
35
-
36
-
37
-
38
-
39
-
40
-
41
-
42
-
43
-
44
-
45
-
46
-
47
-
48
-
49
-
50
-
51
-
52
-
53
-
54
-
55
-
56
-
57
-
58
-
59
-
60
-
61
-
62
-
63
-
64
-
65
-
66
-
67
-
68
-
69
-
70
-
71
-
72
-
73
-
74
-
75
-
76
-
77
-
78
-
79
-
80
-
81
-
82
-
83
-
84
-
85
-
86
-
87
-
88
-
89
-
90
-
91
-
92
-
93
-
94
-
95
-
96
-
97
-
98
-
99
-
100
-
101
-
102
-
103
-
104
-
105
-
106
-
107
-
108
-
109
-
110
-
111
-
112
-
113
-
114
-
115
-
116
-
117
-
118
-
119
-
120
-
121
-
122
-
123
-
124
-
125
-
126
-
127
-
128
-
129
-
130
-
131
-
132
-
133
-
134
-
135
-
136
-
137
-
138
-
139
-
140
-
141
-
142
-
143
-
144
-
145
-
146
-
147
-
148
-
149
-
150
-
151
-
152
-
153
-
154
-
155
-
156
-
157
-
158
-
159
-
160
-
161
-
162
-
163
-
164
-
165
-
166
-
167
-
168
-
169
-
170
-
171
-
172
-
173
-
174
-
175
-
176
-
177
-
178
-
179
-
180
-
181
-
182
-
183
-
184
-
185
-
186
-
187
-
188
-
189
-
190
-
191
-
192
-
193
-
194
-
195
-
196
-
197
-
198
-
199
-
200
-
201
-
202
-
203
-
204
-
205
-
206
-
207
-
208
-
209
-
210
-
211
-
212
-
213
-
214
-
215
-
216
-
217
-
218
-
219
-
220
-
221
-
222
-
223
-
224
-
225
-
226
-
227
-
228
-
229
-
230
-
231
-
232
-
233
-
234
-
235
-
236
-
237
-
238
-
239
-
240
-
241
-
242
-
243
-
244
-
245
-
246
-
247
-
248
-
249
-
250
-
251
-
252
-
253
-
254
-
255
-
256
-
257
-
258
-
259
-
260
-
261
-
262
-
263
-
264
-
265
-
266
-
267
-
268
-
269
-
270
-
271
-
 272
272 -
 273
273 -
 274
274 -
 275
275 -
 276
276 -
 277
277 -
 278
278 -
 279
279 -
 280
280 -
 281
281 -
 282
282 -
 283
283 -
 284
284 -
 285
285 -
 286
286 -
 287
287 -
 288
288 -
 289
289 -
 290
290 -
 291
291 -
 292
292 -
293
-
294
-
295
-
296
-
297
-
298
-
299
-
300
-
301
-
302
-
303
-
304
-
305
-
306
-
307
-
308
-
309
-
310
-
311
-
312
-
313
-
314
-
315
-
316
-
317
-
318
-
319
-
320
-
321
-
322
-
323
-
324
-
325
-
326
-
327
-
328
-
329
-
330
-
331
-
332
-
333
-
334
-
335
-
336
-
337
-
338
-
339
-
340
-
341
-
342
-
343
-
344
-
345
-
346
-
347
-
348
-
349
-
350
-
351
-
352
-
353
-
354
-
355
-
356
-
357
-
358
-
359
-
360
-
361
-
362
-
363
-
364
-
365
-
366
 |
 |

Table of Contents
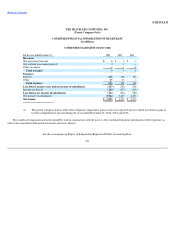
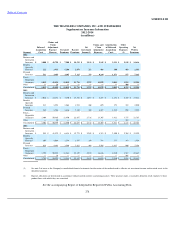
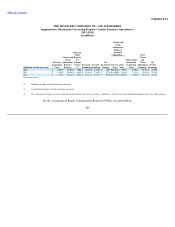
SCHEDULE III
THE TRAVELERS COMPANIES, INC. AND SUBSIDIARIES
Supplementary Insurance Information
2012
-
2014
(in millions)
See the accompanying Report of Independent Registered Public Accounting Firm.
278
Segment
Deferred
Acquisition
Costs
Claims and
Claim
Adjustment
Expense
Reserves
Unearned
Premiums
Earned
Premiums
Net
Investment
Income(1)
Claims and
Claim
Adjustment
Expenses
Amortization
of Deferred
Acquisition
Costs
Other
Operating
Expenses
(2)
Net
Written
Premiums
2014
Business and
International
Insurance
$
1,080
$
42,700
$
7,208
$
14,512
$
2,156
$
9,145
$
2,321
$
2,541
$
14,636
Bond &
Specialty
Insurance
222
3,435
1,286
2,076
252
481
388
403
2,103
Personal
Insurance
533
3,689
3,345
7,125
379
4,244
1,173
977
7,165
Total—
Reportable
Segments
1,835
49,824
11,839
23,713
2,787
13,870
3,882
3,921
23,904
Other
—
26
—
—
—
—
—
400
—
Consolidated
$
1,835
$
49,850
$
11,839
$
23,713
$
2,787
$
13,870
$
3,882
$
4,321
$
23,904
2013
Business and
International
Insurance
$
1,046
$
43,181
$
7,170
$
13,332
$
2,087
$
8,285
$
2,158
$
2,369
$
13,512
Bond &
Specialty
Insurance
213
3,921
1,264
1,981
260
695
378
388
2,030
Personal
Insurance
545
3,763
3,416
7,324
369
4,327
1,285
980
7,225
Total—
Reportable
Segments
1,804
50,865
11,850
22,637
2,716
13,307
3,821
3,737
22,767
Other
—
30
—
—
—
—
—
381
—
Consolidated
$
1,804
$
50,895
$
11,850
$
22,637
$
2,716
$
13,307
$
3,821
$
4,118
$
22,767
2012
Business and
International
Insurance
$
959
$
41,979
$
6,438
$
12,779
$
2,205
$
8,383
$
2,100
$
2,304
$
12,929
Bond &
Specialty
Insurance
209
4,064
1,254
1,957
280
788
373
383
1,924
Personal
Insurance
624
4,845
3,549
7,621
404
5,505
1,437
900
7,594
Total—
Reportable
Segments
1,792
50,888
11,241
22,357
2,889
14,676
3,910
3,587
22,447
Other
—
34
—
—
—
—
—
401
—
Consolidated
$
1,792
$
50,922
$
11,241
$
22,357
$
2,889
$
14,676
$
3,910
$
3,988
$
22,447
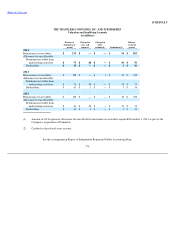
(1)
See note 2 of notes to the Company's consolidated financial statements for discussion of the method used to allocate net investment income and invested assets to the
identified segments.
(2)
Expense allocations are determined in accordance with prescribed statutory accounting practices. These practices make a reasonable allocation of all expenses to those
product lines with which they are associated.