Travelers 2014 Annual Report Download - page 87
Download and view the complete annual report
Please find page 87 of the 2014 Travelers annual report below. You can navigate through the pages in the report by either clicking on the pages listed below, or by using the keyword search tool below to find specific information within the annual report.-
 1
1 -
2
-
3
-
4
-
5
-
6
-
7
-
8
-
9
-
10
-
11
-
12
-
13
-
14
-
15
-
16
-
17
-
18
-
19
-
20
-
21
-
22
-
23
-
24
-
25
-
26
-
27
-
28
-
29
-
30
-
31
-
32
-
33
-
34
-
35
-
36
-
37
-
38
-
39
-
40
-
41
-
42
-
43
-
44
-
45
-
46
-
47
-
48
-
49
-
50
-
51
-
52
-
53
-
54
-
55
-
56
-
57
-
58
-
59
-
60
-
61
-
62
-
63
-
64
-
65
-
66
-
67
-
68
-
69
-
70
-
71
-
72
-
73
-
74
-
75
-
76
-
 77
77 -
 78
78 -
 79
79 -
 80
80 -
 81
81 -
 82
82 -
 83
83 -
 84
84 -
 85
85 -
 86
86 -
 87
87 -
 88
88 -
 89
89 -
 90
90 -
 91
91 -
 92
92 -
 93
93 -
 94
94 -
 95
95 -
 96
96 -
 97
97 -
98
-
99
-
100
-
101
-
102
-
103
-
104
-
105
-
106
-
107
-
108
-
109
-
110
-
111
-
112
-
113
-
114
-
115
-
116
-
117
-
118
-
119
-
120
-
121
-
122
-
123
-
124
-
125
-
126
-
127
-
128
-
129
-
130
-
131
-
132
-
133
-
134
-
135
-
136
-
137
-
138
-
139
-
140
-
141
-
142
-
143
-
144
-
145
-
146
-
147
-
148
-
149
-
150
-
151
-
152
-
153
-
154
-
155
-
156
-
157
-
158
-
159
-
160
-
161
-
162
-
163
-
164
-
165
-
166
-
167
-
168
-
169
-
170
-
171
-
172
-
173
-
174
-
175
-
176
-
177
-
178
-
179
-
180
-
181
-
182
-
183
-
184
-
185
-
186
-
187
-
188
-
189
-
190
-
191
-
192
-
193
-
194
-
195
-
196
-
197
-
198
-
199
-
200
-
201
-
202
-
203
-
204
-
205
-
206
-
207
-
208
-
209
-
210
-
211
-
212
-
213
-
214
-
215
-
216
-
217
-
218
-
219
-
220
-
221
-
222
-
223
-
224
-
225
-
226
-
227
-
228
-
229
-
230
-
231
-
232
-
233
-
234
-
235
-
236
-
237
-
238
-
239
-
240
-
241
-
242
-
243
-
244
-
245
-
246
-
247
-
248
-
249
-
250
-
251
-
252
-
253
-
254
-
255
-
256
-
257
-
258
-
259
-
260
-
261
-
262
-
263
-
264
-
265
-
266
-
267
-
268
-
269
-
270
-
271
-
272
-
273
-
274
-
275
-
276
-
277
-
278
-
279
-
280
-
281
-
282
-
283
-
284
-
285
-
286
-
287
-
288
-
289
-
290
-
291
-
292
-
293
-
294
-
295
-
296
-
297
-
298
-
299
-
300
-
301
-
302
-
303
-
304
-
305
-
306
-
307
-
308
-
309
-
310
-
311
-
312
-
313
-
314
-
315
-
316
-
317
-
318
-
319
-
320
-
321
-
322
-
323
-
324
-
325
-
326
-
327
-
328
-
329
-
330
-
331
-
332
-
333
-
334
-
335
-
336
-
337
-
338
-
339
-
340
-
341
-
342
-
343
-
344
-
345
-
346
-
347
-
348
-
349
-
350
-
351
-
352
-
353
-
354
-
355
-
356
-
357
-
358
-
359
-
360
-
361
-
362
-
363
-
364
-
365
-
366
 |
 |

Table of Contents
General and Administrative Expenses
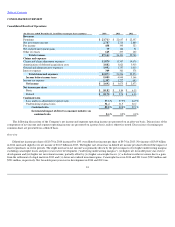
General and administrative expenses in 2014 were $3.95 billion, $195 million or 5% higher than in 2013. The increase in 2014 primarily reflected
the impact of the acquisition of Dominion and increases in employee and technology related expenses, partially offset by a reduction in the
estimated liability for state assessments primarily related to workers' compensation premiums. General and administrative expenses in 2013 were
$3.76 billion, $147 million or 4% higher than in 2012. General and administrative expenses are discussed in more detail in the segment discussions
that follow.
Interest Expense
Interest expense in 2014, 2013 and 2012 was $369 million, $361 million and $378 million, respectively. The increase in 2014 compared with 2013
primarily reflected slightly higher average levels of debt outstanding. The decline in 2013 compared with 2012 primarily reflected lower average
levels of debt outstanding.
Income Tax Expense
Income tax expense in 2014 was $1.40 billion, $125 million or 10% higher than in 2013, primarily reflecting the impact of a $63 million reduction in
income tax expense in 2013 resulting from the resolution of prior year tax matters, as well as the tax effects of the $144 million increase in income
before income taxes in 2014. Income tax expense in 2013 was $1.27 billion, $579 million or 84% higher than in 2012, primarily reflecting the impact of
the tax effects of the $1.78 billion increase in income before income taxes, partially offset by the impact of the $63 million reduction in income tax
expense resulting from the resolution of prior year tax matters in 2013.
The Company's effective tax rate was 27%, 26% and 22% in 2014, 2013 and 2012, respectively. The effective tax rates in all years were lower
than the statutory rate of 35% primarily due to the impact of tax
-
exempt investment income on the calculation of the Company's income tax
provision. In addition, the effective tax rate for 2013 was reduced by the impact of the resolution of prior year tax matters.
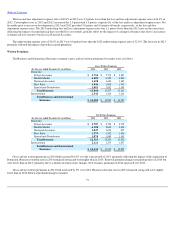
Combined Ratio
The combined ratio of 89.0% in 2014 was 0.8 points lower than the combined ratio of 89.8% in 2013.
The loss and loss adjustment expense ratio of 57.6% in 2014 was 0.3 points lower than the loss and loss adjustment expense ratio of 57.9% in
2013. Catastrophe losses accounted for 3.0 points and 2.6 points of the 2014 and 2013 loss and loss adjustment expense ratios, respectively. Net
favorable prior year reserve development in 2014 and 2013 provided 3.9 points and 3.7 points of benefit, respectively, to the loss and loss
adjustment expense ratio. The 2014 loss and loss adjustment expense ratio excluding catastrophe losses and prior year reserve development
("underlying loss and loss adjustment expense ratio") was 0.5 points lower than the 2013 ratio on the same basis, primarily reflecting the impact of
earned pricing that exceeded loss cost trends, partially offset by the impact of an increase in non
-
catastrophe weather
-
related losses and a higher
level of what the Company defines as large losses.
The underwriting expense ratio of 31.4% in 2014 was 0.5 points lower than the underwriting expense ratio of 31.9% in 2013, primarily reflecting
lower commission expenses in the Personal Insurance segment and a reduction in the estimated liability for state assessments primarily related to
workers' compensation premiums in the Business and International Insurance segment, partially offset by the increase in general and administrative
expenses described above.
86