Travelers 2014 Annual Report Download - page 91
Download and view the complete annual report
Please find page 91 of the 2014 Travelers annual report below. You can navigate through the pages in the report by either clicking on the pages listed below, or by using the keyword search tool below to find specific information within the annual report.-
 1
1 -
2
-
3
-
4
-
5
-
6
-
7
-
8
-
9
-
10
-
11
-
12
-
13
-
14
-
15
-
16
-
17
-
18
-
19
-
20
-
21
-
22
-
23
-
24
-
25
-
26
-
27
-
28
-
29
-
30
-
31
-
32
-
33
-
34
-
35
-
36
-
37
-
38
-
39
-
40
-
41
-
42
-
43
-
44
-
45
-
46
-
47
-
48
-
49
-
50
-
51
-
52
-
53
-
54
-
55
-
56
-
57
-
58
-
59
-
60
-
61
-
62
-
63
-
64
-
65
-
66
-
67
-
68
-
69
-
70
-
71
-
72
-
73
-
74
-
75
-
76
-
77
-
78
-
79
-
80
-
 81
81 -
 82
82 -
 83
83 -
 84
84 -
 85
85 -
 86
86 -
 87
87 -
 88
88 -
 89
89 -
 90
90 -
 91
91 -
 92
92 -
 93
93 -
 94
94 -
 95
95 -
 96
96 -
 97
97 -
 98
98 -
 99
99 -
 100
100 -
 101
101 -
102
-
103
-
104
-
105
-
106
-
107
-
108
-
109
-
110
-
111
-
112
-
113
-
114
-
115
-
116
-
117
-
118
-
119
-
120
-
121
-
122
-
123
-
124
-
125
-
126
-
127
-
128
-
129
-
130
-
131
-
132
-
133
-
134
-
135
-
136
-
137
-
138
-
139
-
140
-
141
-
142
-
143
-
144
-
145
-
146
-
147
-
148
-
149
-
150
-
151
-
152
-
153
-
154
-
155
-
156
-
157
-
158
-
159
-
160
-
161
-
162
-
163
-
164
-
165
-
166
-
167
-
168
-
169
-
170
-
171
-
172
-
173
-
174
-
175
-
176
-
177
-
178
-
179
-
180
-
181
-
182
-
183
-
184
-
185
-
186
-
187
-
188
-
189
-
190
-
191
-
192
-
193
-
194
-
195
-
196
-
197
-
198
-
199
-
200
-
201
-
202
-
203
-
204
-
205
-
206
-
207
-
208
-
209
-
210
-
211
-
212
-
213
-
214
-
215
-
216
-
217
-
218
-
219
-
220
-
221
-
222
-
223
-
224
-
225
-
226
-
227
-
228
-
229
-
230
-
231
-
232
-
233
-
234
-
235
-
236
-
237
-
238
-
239
-
240
-
241
-
242
-
243
-
244
-
245
-
246
-
247
-
248
-
249
-
250
-
251
-
252
-
253
-
254
-
255
-
256
-
257
-
258
-
259
-
260
-
261
-
262
-
263
-
264
-
265
-
266
-
267
-
268
-
269
-
270
-
271
-
272
-
273
-
274
-
275
-
276
-
277
-
278
-
279
-
280
-
281
-
282
-
283
-
284
-
285
-
286
-
287
-
288
-
289
-
290
-
291
-
292
-
293
-
294
-
295
-
296
-
297
-
298
-
299
-
300
-
301
-
302
-
303
-
304
-
305
-
306
-
307
-
308
-
309
-
310
-
311
-
312
-
313
-
314
-
315
-
316
-
317
-
318
-
319
-
320
-
321
-
322
-
323
-
324
-
325
-
326
-
327
-
328
-
329
-
330
-
331
-
332
-
333
-
334
-
335
-
336
-
337
-
338
-
339
-
340
-
341
-
342
-
343
-
344
-
345
-
346
-
347
-
348
-
349
-
350
-
351
-
352
-
353
-
354
-
355
-
356
-
357
-
358
-
359
-
360
-
361
-
362
-
363
-
364
-
365
-
366
 |
 |

Table of Contents
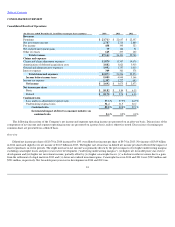
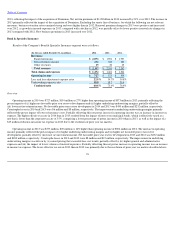
Claims and claim adjustment expenses in 2013 were $8.29 billion, $98 million or 1% lower than in 2012, primarily reflecting (i) a decline in
catastrophe losses and (ii) the impact of a modest decline in volumes of insured exposures (excluding Dominion), partially offset by (iii) the impact
of loss cost trends, (iv) a decrease in net favorable prior year reserve development and (v) the impact of the acquisition of Dominion. Factors
contributing to net favorable prior year reserve development are discussed in more detail in note 7 of notes to the Company's consolidated financial
statements.
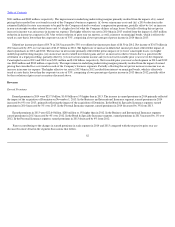
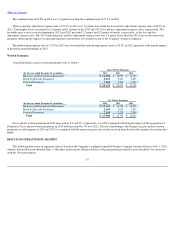
Amortization of Deferred Acquisition Costs
Amortization of deferred acquisition costs in 2014 was $2.32 billion, $163 million or 8% higher than in 2013, primarily reflecting the impact of the
acquisition of Dominion. Amortization of deferred acquisition costs in 2013 was $2.16 billion, $58 million or 3% higher than in 2012. The increase in
2013 was generally consistent with the increase in earned premiums.
General and Administrative Expenses
General and administrative expenses in 2014 were $2.54 billion, $172 million or 7% higher than in 2013, primarily reflecting the impact of the
acquisition of Dominion and increases in employee and technology related expenses, partially offset by a reduction in the estimated liability for
state assessments primarily related to workers' compensation premiums. General and administrative expenses in 2013 were $2.37 billion, $65 million
or 3% higher than in 2012, primarily due to the impact of the acquisition of Dominion and higher employee and technology related costs.
Income Tax Expense
Income tax expense in 2014 was $798 million, $40 million or 5% higher than in 2013, primarily reflecting the impact of a $43 million reduction in
income tax expense in 2013 resulting from the resolution of prior year tax matters, partially offset by the tax effect of the $17 million decrease in pre
-
tax operating income in 2014. Income tax expense in 2013 was $758 million, $178 million or 31% higher than in 2012, primarily reflecting the tax effect
of the $601 million increase in pre
-
tax operating income and the reduction in income tax expense in 2013 resulting from the resolution of prior year
tax matters discussed above.
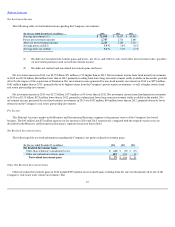
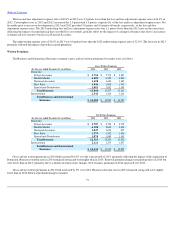
Combined Ratio
The combined ratio of 93.1% in 2014 was 0.3 points higher than the combined ratio of 92.8% in 2013.
The loss and loss adjustment expense ratio of 61.6% in 2014 was 0.8 points higher than the loss and loss adjustment expense ratio of 60.8% in
2013. Catastrophe losses in 2014 and 2013 accounted for 2.5 points of the loss and loss adjustment expense ratio in each year. Net favorable prior
year reserve development in 2014 and 2013 provided 2.2 points and 3.0 points of benefit, respectively, to the loss and loss adjustment expense
ratio. The underlying loss and loss adjustment expense ratio in 2014 was level with the 2013 ratio on the same basis, as the impact of earned pricing
that exceeded loss cost trends was offset by higher non
-
catastrophe weather
-
related losses and a higher level of what the Company defines as
large losses.
The underwriting expense ratio of 31.5% in 2014 was 0.5 points lower than the underwriting expense ratio of 32.0% in 2013, primarily reflecting
the impact of an increase in earned premiums and a reduction in the estimated liability for state assessments primarily related to workers'
compensation premiums, partially offset by the increase in general and administrative expenses discussed above.
The combined ratio of 92.8% in 2013 was 4.3 points lower than the combined ratio of 97.1% in 2012.
90