Travelers 2014 Annual Report Download - page 109
Download and view the complete annual report
Please find page 109 of the 2014 Travelers annual report below. You can navigate through the pages in the report by either clicking on the pages listed below, or by using the keyword search tool below to find specific information within the annual report.-
 1
1 -
2
-
3
-
4
-
5
-
6
-
7
-
8
-
9
-
10
-
11
-
12
-
13
-
14
-
15
-
16
-
17
-
18
-
19
-
20
-
21
-
22
-
23
-
24
-
25
-
26
-
27
-
28
-
29
-
30
-
31
-
32
-
33
-
34
-
35
-
36
-
37
-
38
-
39
-
40
-
41
-
42
-
43
-
44
-
45
-
46
-
47
-
48
-
49
-
50
-
51
-
52
-
53
-
54
-
55
-
56
-
57
-
58
-
59
-
60
-
61
-
62
-
63
-
64
-
65
-
66
-
67
-
68
-
69
-
70
-
71
-
72
-
73
-
74
-
75
-
76
-
77
-
78
-
79
-
80
-
81
-
82
-
83
-
84
-
85
-
86
-
87
-
88
-
89
-
90
-
91
-
92
-
93
-
94
-
95
-
96
-
97
-
98
-
 99
99 -
 100
100 -
 101
101 -
 102
102 -
 103
103 -
 104
104 -
 105
105 -
 106
106 -
 107
107 -
 108
108 -
 109
109 -
 110
110 -
 111
111 -
 112
112 -
 113
113 -
 114
114 -
 115
115 -
 116
116 -
 117
117 -
 118
118 -
 119
119 -
120
-
121
-
122
-
123
-
124
-
125
-
126
-
127
-
128
-
129
-
130
-
131
-
132
-
133
-
134
-
135
-
136
-
137
-
138
-
139
-
140
-
141
-
142
-
143
-
144
-
145
-
146
-
147
-
148
-
149
-
150
-
151
-
152
-
153
-
154
-
155
-
156
-
157
-
158
-
159
-
160
-
161
-
162
-
163
-
164
-
165
-
166
-
167
-
168
-
169
-
170
-
171
-
172
-
173
-
174
-
175
-
176
-
177
-
178
-
179
-
180
-
181
-
182
-
183
-
184
-
185
-
186
-
187
-
188
-
189
-
190
-
191
-
192
-
193
-
194
-
195
-
196
-
197
-
198
-
199
-
200
-
201
-
202
-
203
-
204
-
205
-
206
-
207
-
208
-
209
-
210
-
211
-
212
-
213
-
214
-
215
-
216
-
217
-
218
-
219
-
220
-
221
-
222
-
223
-
224
-
225
-
226
-
227
-
228
-
229
-
230
-
231
-
232
-
233
-
234
-
235
-
236
-
237
-
238
-
239
-
240
-
241
-
242
-
243
-
244
-
245
-
246
-
247
-
248
-
249
-
250
-
251
-
252
-
253
-
254
-
255
-
256
-
257
-
258
-
259
-
260
-
261
-
262
-
263
-
264
-
265
-
266
-
267
-
268
-
269
-
270
-
271
-
272
-
273
-
274
-
275
-
276
-
277
-
278
-
279
-
280
-
281
-
282
-
283
-
284
-
285
-
286
-
287
-
288
-
289
-
290
-
291
-
292
-
293
-
294
-
295
-
296
-
297
-
298
-
299
-
300
-
301
-
302
-
303
-
304
-
305
-
306
-
307
-
308
-
309
-
310
-
311
-
312
-
313
-
314
-
315
-
316
-
317
-
318
-
319
-
320
-
321
-
322
-
323
-
324
-
325
-
326
-
327
-
328
-
329
-
330
-
331
-
332
-
333
-
334
-
335
-
336
-
337
-
338
-
339
-
340
-
341
-
342
-
343
-
344
-
345
-
346
-
347
-
348
-
349
-
350
-
351
-
352
-
353
-
354
-
355
-
356
-
357
-
358
-
359
-
360
-
361
-
362
-
363
-
364
-
365
-
366
 |
 |

Table of Contents
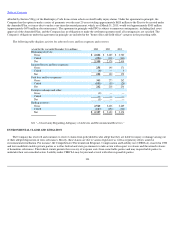
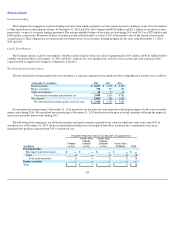
both December 31, 2014 and 2013. Below investment grade securities represented 3.0% of the total fixed maturity investment portfolio at both
December 31, 2014 and 2013. The average effective duration of fixed maturities and short
-
term securities was 3.5 (3.7 excluding short
-
term securities)
at December 31, 2014 and 3.7 (3.9 excluding short
-
term securities) at December 31, 2013. See the "Outlook" section in "Item 7—Management's
Discussion and Analysis of Financial Condition and Results of Operations."
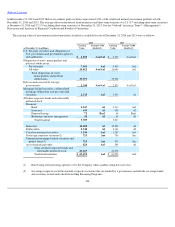
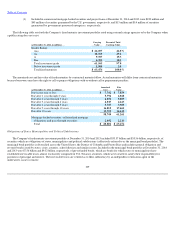
The carrying values of investments in fixed maturities classified as available for sale at December 31, 2014 and 2013 were as follows:
108
2014
2013
(at December 31, in millions)
Carrying
Value
Average Credit
Quality(1)
Carrying
Value
Average Credit
Quality(1)
U.S. Treasury securities and obligations of
U.S. government and government agencies
and authorities
$
2,053
Aaa/Aa1
$
2,315
Aaa/Aa1
Obligations of states, municipalities and
political subdivisions:
Pre
-
refunded
7,561
Aa1
9,518
Aa1
All other
26,012
Aaa/Aa1
26,044
Aa1
Total obligations of states,
municipalities and political
subdivisions
33,573
35,562
Debt securities issued by foreign
governments
2,368
Aaa/Aa1
2,577
Aaa/Aa1
Mortgage
-
backed securities, collateralized
mortgage obligations and pass
-
through
securities
2,213
Aa3
2,424
A1
All other corporate bonds and redeemable
preferred stock:
Financial:
Bank
2,567
A1
2,314
Aa3
Insurance
636
A1
605
A2
Finance/leasing
72
Baa2
68
Baa1
Brokerage and asset management
34
A1
30
A1
Total financial
3,309
3,017
Industrial
14,180
A3
12,859
A3
Public utility
2,320
A2
2,166
A3
Canadian municipal securities
1,194
Aa1
1,207
Aa1
Sovereign corporate securities(2)
725
Aaa
756
Aaa
Commercial mortgage
-
backed securities and
project loans(3)
715
Aaa
475
Aaa
Asset
-
backed and other
824
Aa3
598
A1
Total all other corporate bonds and
redeemable preferred stock
23,267
21,078
Total fixed maturities
$
63,474
Aa2
$
63,956
Aa2
(1)
Rated using external rating agencies or by the Company when a public rating does not exist.
(2)
Sovereign corporate securities include corporate securities that are backed by a government and include sovereign banks
and securities issued under the Federal Ship Financing Programs.