Travelers 2014 Annual Report Download - page 166
Download and view the complete annual report
Please find page 166 of the 2014 Travelers annual report below. You can navigate through the pages in the report by either clicking on the pages listed below, or by using the keyword search tool below to find specific information within the annual report.-
 1
1 -
2
-
3
-
4
-
5
-
6
-
7
-
8
-
9
-
10
-
11
-
12
-
13
-
14
-
15
-
16
-
17
-
18
-
19
-
20
-
21
-
22
-
23
-
24
-
25
-
26
-
27
-
28
-
29
-
30
-
31
-
32
-
33
-
34
-
35
-
36
-
37
-
38
-
39
-
40
-
41
-
42
-
43
-
44
-
45
-
46
-
47
-
48
-
49
-
50
-
51
-
52
-
53
-
54
-
55
-
56
-
57
-
58
-
59
-
60
-
61
-
62
-
63
-
64
-
65
-
66
-
67
-
68
-
69
-
70
-
71
-
72
-
73
-
74
-
75
-
76
-
77
-
78
-
79
-
80
-
81
-
82
-
83
-
84
-
85
-
86
-
87
-
88
-
89
-
90
-
91
-
92
-
93
-
94
-
95
-
96
-
97
-
98
-
99
-
100
-
101
-
102
-
103
-
104
-
105
-
106
-
107
-
108
-
109
-
110
-
111
-
112
-
113
-
114
-
115
-
116
-
117
-
118
-
119
-
120
-
121
-
122
-
123
-
124
-
125
-
126
-
127
-
128
-
129
-
130
-
131
-
132
-
133
-
134
-
135
-
136
-
137
-
138
-
139
-
140
-
141
-
142
-
143
-
144
-
145
-
146
-
147
-
148
-
149
-
150
-
151
-
152
-
153
-
154
-
155
-
 156
156 -
 157
157 -
 158
158 -
 159
159 -
 160
160 -
 161
161 -
 162
162 -
 163
163 -
 164
164 -
 165
165 -
 166
166 -
 167
167 -
 168
168 -
 169
169 -
 170
170 -
 171
171 -
 172
172 -
 173
173 -
 174
174 -
 175
175 -
 176
176 -
177
-
178
-
179
-
180
-
181
-
182
-
183
-
184
-
185
-
186
-
187
-
188
-
189
-
190
-
191
-
192
-
193
-
194
-
195
-
196
-
197
-
198
-
199
-
200
-
201
-
202
-
203
-
204
-
205
-
206
-
207
-
208
-
209
-
210
-
211
-
212
-
213
-
214
-
215
-
216
-
217
-
218
-
219
-
220
-
221
-
222
-
223
-
224
-
225
-
226
-
227
-
228
-
229
-
230
-
231
-
232
-
233
-
234
-
235
-
236
-
237
-
238
-
239
-
240
-
241
-
242
-
243
-
244
-
245
-
246
-
247
-
248
-
249
-
250
-
251
-
252
-
253
-
254
-
255
-
256
-
257
-
258
-
259
-
260
-
261
-
262
-
263
-
264
-
265
-
266
-
267
-
268
-
269
-
270
-
271
-
272
-
273
-
274
-
275
-
276
-
277
-
278
-
279
-
280
-
281
-
282
-
283
-
284
-
285
-
286
-
287
-
288
-
289
-
290
-
291
-
292
-
293
-
294
-
295
-
296
-
297
-
298
-
299
-
300
-
301
-
302
-
303
-
304
-
305
-
306
-
307
-
308
-
309
-
310
-
311
-
312
-
313
-
314
-
315
-
316
-
317
-
318
-
319
-
320
-
321
-
322
-
323
-
324
-
325
-
326
-
327
-
328
-
329
-
330
-
331
-
332
-
333
-
334
-
335
-
336
-
337
-
338
-
339
-
340
-
341
-
342
-
343
-
344
-
345
-
346
-
347
-
348
-
349
-
350
-
351
-
352
-
353
-
354
-
355
-
356
-
357
-
358
-
359
-
360
-
361
-
362
-
363
-
364
-
365
-
366
 |
 |

Table of Contents
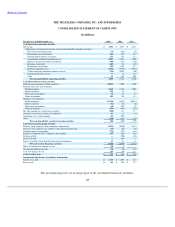
THE TRAVELERS COMPANIES, INC. AND SUBSIDIARIES
CONSOLIDATED STATEMENT OF INCOME
(in millions, except per share amounts)
The accompanying notes are an integral part of the consolidated financial statements.
165
For the year ended December 31,
2014
2013
2012
Revenues
Premiums
$
23,713
$
22,637
$
22,357
Net investment income
2,787
2,716
2,889
Fee income
438
395
323
Net realized investment gains(1)
79
166
51
Other revenues
145
277
120
Total revenues
27,162
26,191
25,740
Claims and expenses
Claims and claim adjustment expenses
13,870
13,307
14,676
Amortization of deferred acquisition costs
3,882
3,821
3,910
General and administrative expenses
3,952
3,757
3,610
Interest expense
369
361
378
Total claims and expenses
22,073
21,246
22,574
Income before income taxes
5,089
4,945
3,166
Income tax expense
1,397
1,272
693
Net income
$
3,692
$
3,673
$
2,473
Net income per share
Basic
$
10.82
$
9.84
$
6.35
Diluted
$
10.70
$
9.74
$
6.30
Weighted average number of common shares outstanding
Basic
338.8
370.3
386.2
Diluted
342.5
374.3
389.8
(1)
Total other
-
than
-
temporary impairment (OTTI) gains (losses) were $(22) million, $(10) million and $27 million for the years
ended December 31, 2014, 2013 and 2012, respectively. Of total OTTI, credit losses of $(26) million, $(15) million and $(15)
million for the years ended December 31, 2014, 2013 and 2012, respectively, were recognized in net realized investment gains.
In addition, unrealized gains from other changes in total OTTI of $4 million, $5 million and $42 million for the years ended
December 31, 2014, 2013 and 2012, respectively, were recognized in other comprehensive income (loss) as part of changes in
net unrealized gains on investment securities having credit losses recognized in the consolidated statement of income.