Travelers 2014 Annual Report Download - page 213
Download and view the complete annual report
Please find page 213 of the 2014 Travelers annual report below. You can navigate through the pages in the report by either clicking on the pages listed below, or by using the keyword search tool below to find specific information within the annual report.-
 1
1 -
2
-
3
-
4
-
5
-
6
-
7
-
8
-
9
-
10
-
11
-
12
-
13
-
14
-
15
-
16
-
17
-
18
-
19
-
20
-
21
-
22
-
23
-
24
-
25
-
26
-
27
-
28
-
29
-
30
-
31
-
32
-
33
-
34
-
35
-
36
-
37
-
38
-
39
-
40
-
41
-
42
-
43
-
44
-
45
-
46
-
47
-
48
-
49
-
50
-
51
-
52
-
53
-
54
-
55
-
56
-
57
-
58
-
59
-
60
-
61
-
62
-
63
-
64
-
65
-
66
-
67
-
68
-
69
-
70
-
71
-
72
-
73
-
74
-
75
-
76
-
77
-
78
-
79
-
80
-
81
-
82
-
83
-
84
-
85
-
86
-
87
-
88
-
89
-
90
-
91
-
92
-
93
-
94
-
95
-
96
-
97
-
98
-
99
-
100
-
101
-
102
-
103
-
104
-
105
-
106
-
107
-
108
-
109
-
110
-
111
-
112
-
113
-
114
-
115
-
116
-
117
-
118
-
119
-
120
-
121
-
122
-
123
-
124
-
125
-
126
-
127
-
128
-
129
-
130
-
131
-
132
-
133
-
134
-
135
-
136
-
137
-
138
-
139
-
140
-
141
-
142
-
143
-
144
-
145
-
146
-
147
-
148
-
149
-
150
-
151
-
152
-
153
-
154
-
155
-
156
-
157
-
158
-
159
-
160
-
161
-
162
-
163
-
164
-
165
-
166
-
167
-
168
-
169
-
170
-
171
-
172
-
173
-
174
-
175
-
176
-
177
-
178
-
179
-
180
-
181
-
182
-
183
-
184
-
185
-
186
-
187
-
188
-
189
-
190
-
191
-
192
-
193
-
194
-
195
-
196
-
197
-
198
-
199
-
200
-
201
-
202
-
 203
203 -
 204
204 -
 205
205 -
 206
206 -
 207
207 -
 208
208 -
 209
209 -
 210
210 -
 211
211 -
 212
212 -
 213
213 -
 214
214 -
 215
215 -
 216
216 -
 217
217 -
 218
218 -
 219
219 -
 220
220 -
 221
221 -
 222
222 -
 223
223 -
224
-
225
-
226
-
227
-
228
-
229
-
230
-
231
-
232
-
233
-
234
-
235
-
236
-
237
-
238
-
239
-
240
-
241
-
242
-
243
-
244
-
245
-
246
-
247
-
248
-
249
-
250
-
251
-
252
-
253
-
254
-
255
-
256
-
257
-
258
-
259
-
260
-
261
-
262
-
263
-
264
-
265
-
266
-
267
-
268
-
269
-
270
-
271
-
272
-
273
-
274
-
275
-
276
-
277
-
278
-
279
-
280
-
281
-
282
-
283
-
284
-
285
-
286
-
287
-
288
-
289
-
290
-
291
-
292
-
293
-
294
-
295
-
296
-
297
-
298
-
299
-
300
-
301
-
302
-
303
-
304
-
305
-
306
-
307
-
308
-
309
-
310
-
311
-
312
-
313
-
314
-
315
-
316
-
317
-
318
-
319
-
320
-
321
-
322
-
323
-
324
-
325
-
326
-
327
-
328
-
329
-
330
-
331
-
332
-
333
-
334
-
335
-
336
-
337
-
338
-
339
-
340
-
341
-
342
-
343
-
344
-
345
-
346
-
347
-
348
-
349
-
350
-
351
-
352
-
353
-
354
-
355
-
356
-
357
-
358
-
359
-
360
-
361
-
362
-
363
-
364
-
365
-
366
 |
 |

Table of Contents
THE TRAVELERS COMPANIES, INC. AND SUBSIDIARIES
NOTES TO CONSOLIDATED FINANCIAL STATEMENTS (Continued)
7. INSURANCE CLAIM RESERVES (Continued)
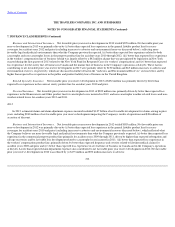
Business and International Insurance. Net favorable prior year reserve development in 2013 totaled $399 million. Net favorable prior year
reserve development in 2013 was primarily driven by (i) better than expected loss experience in the general liability product line for excess
coverages for accident years 2012 and prior (excluding increases to asbestos and environmental reserves discussed below), reflecting more
favorable legal and judicial environments than what the Company previously expected, (ii) better than expected loss experience related to both
catastrophe and non
-
catastrophe losses in the property product line for accident years 2010 through 2012, (iii) better than expected loss experience
in the workers' compensation line of business (which was largely offset by a $42 million charge that was precipitated by legislation in New York
enacted during the first quarter of 2013 related to the New York Fund for Reopened Cases for workers' compensation) and (iv) better than expected
loss experience for the surety line of business in Canada and the marine line of business in the Company's operations at Lloyd's. These factors
contributing to net favorable prior year reserve development in 2013 were partially offset by $190 million and $65 million increases to asbestos and
environmental reserves, respectively, which are discussed in further detail in the "Asbestos and Environmental Reserves" section below and by
higher than expected loss experience in the public and product liability line of business in the United Kingdom.
Bond & Specialty Insurance. Net favorable prior year reserve development in 2013 of $232 million was primarily driven by better than
expected loss experience in the contract surety product line for accident years 2010 and prior.
Personal Insurance. Net favorable prior year reserve development in 2013 of $209 million was primarily driven by better than expected loss
experience in the Homeowners and Other product line for catastrophe losses incurred in 2012, and non
-
catastrophe weather
-
related losses and non
-
weather
-
related losses for accident years 2012 and 2011.
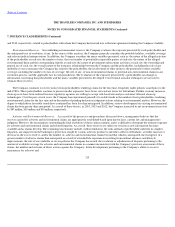
2012.
In 2012, estimated claims and claim adjustment expenses incurred included $1.07 billion of net favorable development for claims arising in prior
years, including $940 million of net favorable prior year reserve development impacting the Company's results of operations and $48 million of
accretion of discount.
Business and International Insurance. Net favorable prior year reserve development in 2012 totaled $585 million. Net favorable prior year
reserve development in 2012 was primarily driven by (i) better than expected loss experience in the general liability product line for excess
coverages for accident years 2010 and prior (excluding increases to asbestos and environmental reserves discussed below), which reflected what
the Company believes are more favorable legal and judicial environments than what the Company previously expected, (ii) better than expected loss
experience in the commercial property product line primarily for accident years 2009 through 2011, driven by higher than expected subrogation and
salvage recoveries and by favorable loss development related to catastrophe losses incurred in 2011; (iii) better than expected loss experience in
the workers' compensation product line, primarily driven by better than expected frequency and severity related to lifetime medical claims for
accident years 2008 and prior and (iv) better than expected loss experience in several lines of business in Canada and in the Company's operations
at Lloyd's. Lower than expected claim department expenses also contributed to net favorable prior year reserve development in 2012. Net favorable
prior year reserve development in 2012 was reduced by (i) $175 million and $90 million increases to asbestos
212