Travelers 2014 Annual Report Download - page 119
Download and view the complete annual report
Please find page 119 of the 2014 Travelers annual report below. You can navigate through the pages in the report by either clicking on the pages listed below, or by using the keyword search tool below to find specific information within the annual report.-
 1
1 -
2
-
3
-
4
-
5
-
6
-
7
-
8
-
9
-
10
-
11
-
12
-
13
-
14
-
15
-
16
-
17
-
18
-
19
-
20
-
21
-
22
-
23
-
24
-
25
-
26
-
27
-
28
-
29
-
30
-
31
-
32
-
33
-
34
-
35
-
36
-
37
-
38
-
39
-
40
-
41
-
42
-
43
-
44
-
45
-
46
-
47
-
48
-
49
-
50
-
51
-
52
-
53
-
54
-
55
-
56
-
57
-
58
-
59
-
60
-
61
-
62
-
63
-
64
-
65
-
66
-
67
-
68
-
69
-
70
-
71
-
72
-
73
-
74
-
75
-
76
-
77
-
78
-
79
-
80
-
81
-
82
-
83
-
84
-
85
-
86
-
87
-
88
-
89
-
90
-
91
-
92
-
93
-
94
-
95
-
96
-
97
-
98
-
99
-
100
-
101
-
102
-
103
-
104
-
105
-
106
-
107
-
108
-
 109
109 -
 110
110 -
 111
111 -
 112
112 -
 113
113 -
 114
114 -
 115
115 -
 116
116 -
 117
117 -
 118
118 -
 119
119 -
 120
120 -
 121
121 -
 122
122 -
 123
123 -
 124
124 -
 125
125 -
 126
126 -
 127
127 -
 128
128 -
 129
129 -
130
-
131
-
132
-
133
-
134
-
135
-
136
-
137
-
138
-
139
-
140
-
141
-
142
-
143
-
144
-
145
-
146
-
147
-
148
-
149
-
150
-
151
-
152
-
153
-
154
-
155
-
156
-
157
-
158
-
159
-
160
-
161
-
162
-
163
-
164
-
165
-
166
-
167
-
168
-
169
-
170
-
171
-
172
-
173
-
174
-
175
-
176
-
177
-
178
-
179
-
180
-
181
-
182
-
183
-
184
-
185
-
186
-
187
-
188
-
189
-
190
-
191
-
192
-
193
-
194
-
195
-
196
-
197
-
198
-
199
-
200
-
201
-
202
-
203
-
204
-
205
-
206
-
207
-
208
-
209
-
210
-
211
-
212
-
213
-
214
-
215
-
216
-
217
-
218
-
219
-
220
-
221
-
222
-
223
-
224
-
225
-
226
-
227
-
228
-
229
-
230
-
231
-
232
-
233
-
234
-
235
-
236
-
237
-
238
-
239
-
240
-
241
-
242
-
243
-
244
-
245
-
246
-
247
-
248
-
249
-
250
-
251
-
252
-
253
-
254
-
255
-
256
-
257
-
258
-
259
-
260
-
261
-
262
-
263
-
264
-
265
-
266
-
267
-
268
-
269
-
270
-
271
-
272
-
273
-
274
-
275
-
276
-
277
-
278
-
279
-
280
-
281
-
282
-
283
-
284
-
285
-
286
-
287
-
288
-
289
-
290
-
291
-
292
-
293
-
294
-
295
-
296
-
297
-
298
-
299
-
300
-
301
-
302
-
303
-
304
-
305
-
306
-
307
-
308
-
309
-
310
-
311
-
312
-
313
-
314
-
315
-
316
-
317
-
318
-
319
-
320
-
321
-
322
-
323
-
324
-
325
-
326
-
327
-
328
-
329
-
330
-
331
-
332
-
333
-
334
-
335
-
336
-
337
-
338
-
339
-
340
-
341
-
342
-
343
-
344
-
345
-
346
-
347
-
348
-
349
-
350
-
351
-
352
-
353
-
354
-
355
-
356
-
357
-
358
-
359
-
360
-
361
-
362
-
363
-
364
-
365
-
366
 |
 |

Table of Contents
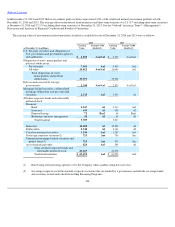
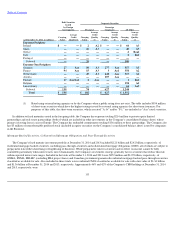
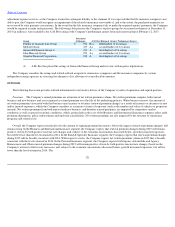
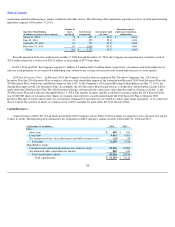
The threshold loss amounts in the tables above, which are based on the Company's in
-
force portfolio at December 31, 2014 and catastrophic
reinsurance program at January 1, 2015, are net of reinsurance, after
-
tax and exclude unallocated claim adjustment expenses, which historically have
been less than 10% of loss estimates. For further information regarding the Company's reinsurance, see "Item 1—Reinsurance." The amounts for
hurricanes reflect U.S. exposures and include property exposures, property residual market exposures and an adjustment for certain non
-
property
exposures. The hurricane loss amounts are based on the Company's catastrophe risk model estimates and include losses from the hurricane hazards
of wind and storm surge. The amounts for earthquakes reflect U.S. and Canadian property and workers' compensation exposures. The Company
does not believe that the inclusion of hurricane or earthquake losses arising from other geographical areas or other exposures would materially
change the estimated threshold loss amounts.
Catastrophe modeling relies upon inputs based on experience, science, engineering and history. These inputs reflect a significant amount of
judgment and are subject to changes which may result in volatility in the modeled output. Catastrophe modeling output may also fail to account for
risks that are outside the range of normal probability or are otherwise unforeseeable. Catastrophe modeling assumptions include, among others, the
portion of purchased reinsurance that is collectible after a catastrophic event, which may prove to be materially incorrect. Consequently,
catastrophe modeling estimates are subject to significant uncertainty. In the tables above, the uncertainty associated with the estimated threshold
loss amounts increases significantly as the likelihood of exceedance decreases. In other words, in the case of a relatively more remote event (e.g., 1
-
in
-
1,000), the estimated threshold loss amount is relatively less reliable. Actual losses from an event could materially exceed the indicated threshold
loss amount. In addition, more than one such event could occur in any period.
Moreover, the Company is exposed to the risk of material losses from other than property and workers' compensation coverages arising out of
hurricanes and earthquakes, and it is exposed to catastrophe losses from perils other than hurricanes and earthquakes, such as tornadoes and
other windstorms, hail, wildfires, severe winter weather, floods, tsunamis, volcanic eruptions and other naturally
-
occurring events, such as solar
flares, as well as acts of terrorism and cyber
-
risk.
For more information about the Company's exposure to catastrophe losses, see "Item 1A—Risk Factors—Catastrophe losses could materially
and adversely affect our results of operations, our financial position and/or liquidity, and could adversely impact our ratings, our ability to raise
capital and the availability and cost of reinsurance" and "Item 1A—Risk Factors—We may be adversely affected if our pricing and capital models
provide materially different indications than actual results."
CHANGING CLIMATE CONDITIONS
Severe weather events over the last several years have underscored the unpredictability of future climate trends and created uncertainty
regarding insurers' exposures to financial loss as a result of catastrophes and other weather
-
related events. For example, over the last decade
hurricane activity has impacted areas further inland than previously experienced by the Company, thus expanding the Company's potential for
losses from hurricanes. Additionally, both the frequency and severity of tornado and hail storms in the United States have been more volatile in
recent years, while any further
118
(2)
The percentage of common equity is calculated by dividing (a) indicated loss amounts in dollars by (b) total common
equity excluding net unrealized investment gains and losses, net of taxes. Net unrealized investment gains and losses
can be significantly impacted by both discretionary and other economic factors and are not necessarily indicative of
operating trends. Accordingly, the Company's management uses the percentage of common equity calculated on this
basis as a metric to evaluate the potential impact of a single hurricane or single earthquake on the Company's financial
position for purposes of making underwriting and reinsurance decisions.