Travelers 2014 Annual Report Download - page 199
Download and view the complete annual report
Please find page 199 of the 2014 Travelers annual report below. You can navigate through the pages in the report by either clicking on the pages listed below, or by using the keyword search tool below to find specific information within the annual report.-
 1
1 -
2
-
3
-
4
-
5
-
6
-
7
-
8
-
9
-
10
-
11
-
12
-
13
-
14
-
15
-
16
-
17
-
18
-
19
-
20
-
21
-
22
-
23
-
24
-
25
-
26
-
27
-
28
-
29
-
30
-
31
-
32
-
33
-
34
-
35
-
36
-
37
-
38
-
39
-
40
-
41
-
42
-
43
-
44
-
45
-
46
-
47
-
48
-
49
-
50
-
51
-
52
-
53
-
54
-
55
-
56
-
57
-
58
-
59
-
60
-
61
-
62
-
63
-
64
-
65
-
66
-
67
-
68
-
69
-
70
-
71
-
72
-
73
-
74
-
75
-
76
-
77
-
78
-
79
-
80
-
81
-
82
-
83
-
84
-
85
-
86
-
87
-
88
-
89
-
90
-
91
-
92
-
93
-
94
-
95
-
96
-
97
-
98
-
99
-
100
-
101
-
102
-
103
-
104
-
105
-
106
-
107
-
108
-
109
-
110
-
111
-
112
-
113
-
114
-
115
-
116
-
117
-
118
-
119
-
120
-
121
-
122
-
123
-
124
-
125
-
126
-
127
-
128
-
129
-
130
-
131
-
132
-
133
-
134
-
135
-
136
-
137
-
138
-
139
-
140
-
141
-
142
-
143
-
144
-
145
-
146
-
147
-
148
-
149
-
150
-
151
-
152
-
153
-
154
-
155
-
156
-
157
-
158
-
159
-
160
-
161
-
162
-
163
-
164
-
165
-
166
-
167
-
168
-
169
-
170
-
171
-
172
-
173
-
174
-
175
-
176
-
177
-
178
-
179
-
180
-
181
-
182
-
183
-
184
-
185
-
186
-
187
-
188
-
 189
189 -
 190
190 -
 191
191 -
 192
192 -
 193
193 -
 194
194 -
 195
195 -
 196
196 -
 197
197 -
 198
198 -
 199
199 -
 200
200 -
 201
201 -
 202
202 -
 203
203 -
 204
204 -
 205
205 -
 206
206 -
 207
207 -
 208
208 -
 209
209 -
210
-
211
-
212
-
213
-
214
-
215
-
216
-
217
-
218
-
219
-
220
-
221
-
222
-
223
-
224
-
225
-
226
-
227
-
228
-
229
-
230
-
231
-
232
-
233
-
234
-
235
-
236
-
237
-
238
-
239
-
240
-
241
-
242
-
243
-
244
-
245
-
246
-
247
-
248
-
249
-
250
-
251
-
252
-
253
-
254
-
255
-
256
-
257
-
258
-
259
-
260
-
261
-
262
-
263
-
264
-
265
-
266
-
267
-
268
-
269
-
270
-
271
-
272
-
273
-
274
-
275
-
276
-
277
-
278
-
279
-
280
-
281
-
282
-
283
-
284
-
285
-
286
-
287
-
288
-
289
-
290
-
291
-
292
-
293
-
294
-
295
-
296
-
297
-
298
-
299
-
300
-
301
-
302
-
303
-
304
-
305
-
306
-
307
-
308
-
309
-
310
-
311
-
312
-
313
-
314
-
315
-
316
-
317
-
318
-
319
-
320
-
321
-
322
-
323
-
324
-
325
-
326
-
327
-
328
-
329
-
330
-
331
-
332
-
333
-
334
-
335
-
336
-
337
-
338
-
339
-
340
-
341
-
342
-
343
-
344
-
345
-
346
-
347
-
348
-
349
-
350
-
351
-
352
-
353
-
354
-
355
-
356
-
357
-
358
-
359
-
360
-
361
-
362
-
363
-
364
-
365
-
366
 |
 |

Table of Contents
THE TRAVELERS COMPANIES, INC. AND SUBSIDIARIES
NOTES TO CONSOLIDATED FINANCIAL STATEMENTS (Continued)
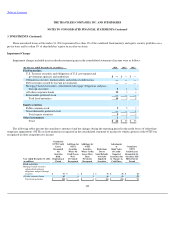
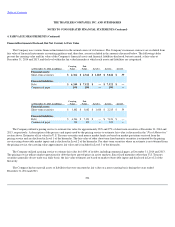
4. FAIR VALUE MEASUREMENTS (Continued)
within which the fair value measurement is reported is based on the lowest level input that is significant to the measurement in its entirety. The
three levels of the hierarchy are as follows:
•
Level 1
—Unadjusted quoted market prices for identical assets or liabilities in active markets that the Company has the ability to
access.
•
Level 2
—Quoted prices for similar assets or liabilities in active markets; quoted prices for identical or similar assets or liabilities in
inactive markets; or valuations based on models where the significant inputs are observable (e.g., interest rates, yield curves,
prepayment speeds, default rates, loss severities, etc.) or can be corroborated by observable market data.
•
Level 3
—Valuations based on models where significant inputs are not observable. The unobservable inputs reflect the Company's
own assumptions about the inputs that market participants would use.
Valuation of Investments Reported at Fair Value in Financial Statements
The fair value of a financial instrument is the estimated amount at which the instrument could be exchanged in an orderly transaction between
knowledgeable, unrelated, willing parties, i.e., not in a forced transaction. The estimated fair value of a financial instrument may differ from the
amount that could be realized if the security was sold in an immediate sale, e.g., a forced transaction. Additionally, the valuation of investments is
more subjective when markets are less liquid due to the lack of market based inputs, which may increase the potential that the estimated fair value
of an investment is not reflective of the price at which an actual transaction would occur.
For investments that have quoted market prices in active markets, the Company uses the unadjusted quoted market prices as fair value and
includes these prices in the amounts disclosed in Level 1 of the hierarchy. The Company receives the quoted market prices from third party,
nationally recognized pricing services. When quoted market prices are unavailable, the Company utilizes these pricing services to determine an
estimate of fair value. The fair value estimates provided from these pricing services are included in the amount disclosed in Level 2 of the hierarchy.
If quoted market prices and an estimate from a pricing service are unavailable, the Company produces an estimate of fair value based on internally
developed valuation techniques, which, depending on the level of observable market inputs, will render the fair value estimate as Level 2 or Level 3.
The Company bases all of its estimates of fair value for assets on the bid price as it represents what a third
-
party market participant would be
willing to pay in an arm's length transaction.
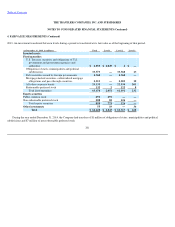
Fixed Maturities
The Company utilized a pricing service to estimate fair value measurements for approximately 98% of its fixed maturities at both December 31,
2014 and 2013. The pricing service utilizes market quotations for fixed maturity securities that have quoted prices in active markets. Since fixed
maturities other than U.S. Treasury securities generally do not trade on a daily basis, the pricing service prepares estimates of fair value
measurements for these securities using its proprietary pricing applications, which include available relevant market information, benchmark curves,
benchmarking of like securities, sector groupings and matrix pricing. Additionally, the pricing service uses an Option Adjusted Spread model to
develop prepayment and interest rate scenarios.
198