Travelers 2014 Annual Report Download - page 261
Download and view the complete annual report
Please find page 261 of the 2014 Travelers annual report below. You can navigate through the pages in the report by either clicking on the pages listed below, or by using the keyword search tool below to find specific information within the annual report.-
 1
1 -
2
-
3
-
4
-
5
-
6
-
7
-
8
-
9
-
10
-
11
-
12
-
13
-
14
-
15
-
16
-
17
-
18
-
19
-
20
-
21
-
22
-
23
-
24
-
25
-
26
-
27
-
28
-
29
-
30
-
31
-
32
-
33
-
34
-
35
-
36
-
37
-
38
-
39
-
40
-
41
-
42
-
43
-
44
-
45
-
46
-
47
-
48
-
49
-
50
-
51
-
52
-
53
-
54
-
55
-
56
-
57
-
58
-
59
-
60
-
61
-
62
-
63
-
64
-
65
-
66
-
67
-
68
-
69
-
70
-
71
-
72
-
73
-
74
-
75
-
76
-
77
-
78
-
79
-
80
-
81
-
82
-
83
-
84
-
85
-
86
-
87
-
88
-
89
-
90
-
91
-
92
-
93
-
94
-
95
-
96
-
97
-
98
-
99
-
100
-
101
-
102
-
103
-
104
-
105
-
106
-
107
-
108
-
109
-
110
-
111
-
112
-
113
-
114
-
115
-
116
-
117
-
118
-
119
-
120
-
121
-
122
-
123
-
124
-
125
-
126
-
127
-
128
-
129
-
130
-
131
-
132
-
133
-
134
-
135
-
136
-
137
-
138
-
139
-
140
-
141
-
142
-
143
-
144
-
145
-
146
-
147
-
148
-
149
-
150
-
151
-
152
-
153
-
154
-
155
-
156
-
157
-
158
-
159
-
160
-
161
-
162
-
163
-
164
-
165
-
166
-
167
-
168
-
169
-
170
-
171
-
172
-
173
-
174
-
175
-
176
-
177
-
178
-
179
-
180
-
181
-
182
-
183
-
184
-
185
-
186
-
187
-
188
-
189
-
190
-
191
-
192
-
193
-
194
-
195
-
196
-
197
-
198
-
199
-
200
-
201
-
202
-
203
-
204
-
205
-
206
-
207
-
208
-
209
-
210
-
211
-
212
-
213
-
214
-
215
-
216
-
217
-
218
-
219
-
220
-
221
-
222
-
223
-
224
-
225
-
226
-
227
-
228
-
229
-
230
-
231
-
232
-
233
-
234
-
235
-
236
-
237
-
238
-
239
-
240
-
241
-
242
-
243
-
244
-
245
-
246
-
247
-
248
-
249
-
250
-
 251
251 -
 252
252 -
 253
253 -
 254
254 -
 255
255 -
 256
256 -
 257
257 -
 258
258 -
 259
259 -
 260
260 -
 261
261 -
 262
262 -
 263
263 -
 264
264 -
 265
265 -
 266
266 -
 267
267 -
 268
268 -
 269
269 -
 270
270 -
 271
271 -
272
-
273
-
274
-
275
-
276
-
277
-
278
-
279
-
280
-
281
-
282
-
283
-
284
-
285
-
286
-
287
-
288
-
289
-
290
-
291
-
292
-
293
-
294
-
295
-
296
-
297
-
298
-
299
-
300
-
301
-
302
-
303
-
304
-
305
-
306
-
307
-
308
-
309
-
310
-
311
-
312
-
313
-
314
-
315
-
316
-
317
-
318
-
319
-
320
-
321
-
322
-
323
-
324
-
325
-
326
-
327
-
328
-
329
-
330
-
331
-
332
-
333
-
334
-
335
-
336
-
337
-
338
-
339
-
340
-
341
-
342
-
343
-
344
-
345
-
346
-
347
-
348
-
349
-
350
-
351
-
352
-
353
-
354
-
355
-
356
-
357
-
358
-
359
-
360
-
361
-
362
-
363
-
364
-
365
-
366
 |
 |

Table of Contents
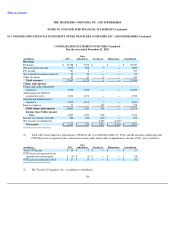
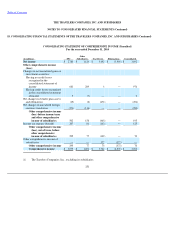
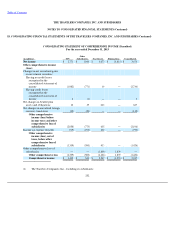
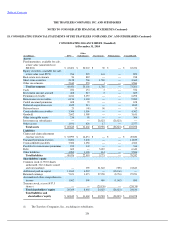
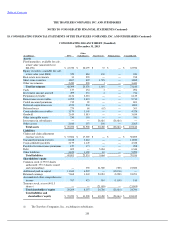
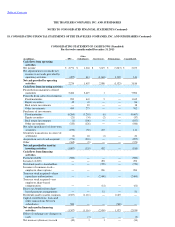
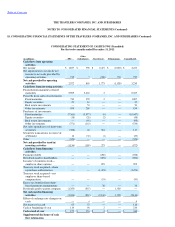
THE TRAVELERS COMPANIES, INC. AND SUBSIDIARIES
NOTES TO CONSOLIDATED FINANCIAL STATEMENTS (Continued)
18. CONSOLIDATING FINANCIAL STATEMENTS OF THE TRAVELERS COMPANIES, INC. AND SUBSIDIARIES (Continued)
CONSOLIDATING STATEMENT OF CASH FLOWS (Unaudited)
For the twelve months ended December 31, 2012
(in millions)
TPC
Other
Subsidiaries
Travelers(1)
Eliminations
Consolidated
Cash flows from operating
activities
Net income
$
1,857
$
798
$
2,473
$
(2,655
)
$
2,473
Net adjustments to reconcile net
income to net cash provided by
operating activities
715
7
(700
)
735
757
Net cash provided by operating
activities
2,572
805
1,773
(1,920
)
3,230
Cash flows from investing activities
Proceeds from maturities of fixed
maturities
5,905
2,462
2
—
8,369
Proceeds from sales of investments:
Fixed maturities
730
355
2
—
1,087
Equity securities
21
16
—
—
37
Real estate investments
—
53
—
—
53
Other investments
555
280
—
—
835
Purchases of investments:
Fixed maturities
(7,361
)
(3,077
)
(9
)
—
(
10,447
)
Equity securities
(18
)
(28
)
(2
)
—
(
48
)
Real estate investments
—
(
95
)
—
—
(
95
)
Other investments
(371
)
(163
)
—
—
(
534
)
Net sales (purchases) of short
-
term
securities
(308
)
44
381
—
117
Securities transactions in course of
settlement
14
(36
)
(1
)
—
(
23
)
Other
(323
)
—
—
—
(
323
)
Net cash provided by (used in)
investing activities
(1,156
)
(189
)
373
—
(
972
)
Cash flows from financing
activities
Payment of debt
—
—
(
258
)
—
(
258
)
Dividends paid to shareholders
—
—
(
694
)
—
(
694
)
Issuance of common stock—
employee share options
—
—
295
—
295
Treasury stock acquired—share
repurchase authorization
—
—
(
1,474
)
—
(
1,474
)
Treasury stock acquired—net
employee share
-
based
compensation
—
—
(
53
)
—
(
53
)
Excess tax benefits from share
-
based payment arrangements
—
—
38
—
38
Dividends paid to parent company
(1,353
)
(567
)
—
1,920
—
Net cash used in financing
activities
(1,353
)
(567
)
(2,146
)
1,920
(2,146
)
Effect of exchange rate changes on
cash
—
4
—
—
4
Net increase in cash
63
53
—
—
116
Cash at beginning of year
114
98
2
—
214
Cash at end of year
$
177
$
151
$
2
$
—
$
330
Supplemental disclosure of cash
flow information