Travelers 2014 Annual Report Download - page 130
Download and view the complete annual report
Please find page 130 of the 2014 Travelers annual report below. You can navigate through the pages in the report by either clicking on the pages listed below, or by using the keyword search tool below to find specific information within the annual report.-
 1
1 -
2
-
3
-
4
-
5
-
6
-
7
-
8
-
9
-
10
-
11
-
12
-
13
-
14
-
15
-
16
-
17
-
18
-
19
-
20
-
21
-
22
-
23
-
24
-
25
-
26
-
27
-
28
-
29
-
30
-
31
-
32
-
33
-
34
-
35
-
36
-
37
-
38
-
39
-
40
-
41
-
42
-
43
-
44
-
45
-
46
-
47
-
48
-
49
-
50
-
51
-
52
-
53
-
54
-
55
-
56
-
57
-
58
-
59
-
60
-
61
-
62
-
63
-
64
-
65
-
66
-
67
-
68
-
69
-
70
-
71
-
72
-
73
-
74
-
75
-
76
-
77
-
78
-
79
-
80
-
81
-
82
-
83
-
84
-
85
-
86
-
87
-
88
-
89
-
90
-
91
-
92
-
93
-
94
-
95
-
96
-
97
-
98
-
99
-
100
-
101
-
102
-
103
-
104
-
105
-
106
-
107
-
108
-
109
-
110
-
111
-
112
-
113
-
114
-
115
-
116
-
117
-
118
-
119
-
 120
120 -
 121
121 -
 122
122 -
 123
123 -
 124
124 -
 125
125 -
 126
126 -
 127
127 -
 128
128 -
 129
129 -
 130
130 -
 131
131 -
 132
132 -
 133
133 -
 134
134 -
 135
135 -
 136
136 -
 137
137 -
 138
138 -
 139
139 -
 140
140 -
141
-
142
-
143
-
144
-
145
-
146
-
147
-
148
-
149
-
150
-
151
-
152
-
153
-
154
-
155
-
156
-
157
-
158
-
159
-
160
-
161
-
162
-
163
-
164
-
165
-
166
-
167
-
168
-
169
-
170
-
171
-
172
-
173
-
174
-
175
-
176
-
177
-
178
-
179
-
180
-
181
-
182
-
183
-
184
-
185
-
186
-
187
-
188
-
189
-
190
-
191
-
192
-
193
-
194
-
195
-
196
-
197
-
198
-
199
-
200
-
201
-
202
-
203
-
204
-
205
-
206
-
207
-
208
-
209
-
210
-
211
-
212
-
213
-
214
-
215
-
216
-
217
-
218
-
219
-
220
-
221
-
222
-
223
-
224
-
225
-
226
-
227
-
228
-
229
-
230
-
231
-
232
-
233
-
234
-
235
-
236
-
237
-
238
-
239
-
240
-
241
-
242
-
243
-
244
-
245
-
246
-
247
-
248
-
249
-
250
-
251
-
252
-
253
-
254
-
255
-
256
-
257
-
258
-
259
-
260
-
261
-
262
-
263
-
264
-
265
-
266
-
267
-
268
-
269
-
270
-
271
-
272
-
273
-
274
-
275
-
276
-
277
-
278
-
279
-
280
-
281
-
282
-
283
-
284
-
285
-
286
-
287
-
288
-
289
-
290
-
291
-
292
-
293
-
294
-
295
-
296
-
297
-
298
-
299
-
300
-
301
-
302
-
303
-
304
-
305
-
306
-
307
-
308
-
309
-
310
-
311
-
312
-
313
-
314
-
315
-
316
-
317
-
318
-
319
-
320
-
321
-
322
-
323
-
324
-
325
-
326
-
327
-
328
-
329
-
330
-
331
-
332
-
333
-
334
-
335
-
336
-
337
-
338
-
339
-
340
-
341
-
342
-
343
-
344
-
345
-
346
-
347
-
348
-
349
-
350
-
351
-
352
-
353
-
354
-
355
-
356
-
357
-
358
-
359
-
360
-
361
-
362
-
363
-
364
-
365
-
366
 |
 |

Table of Contents
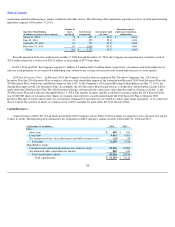
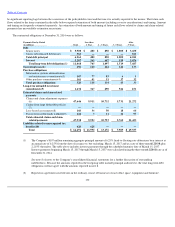
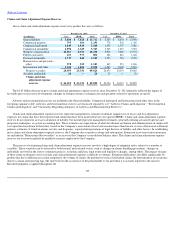
Total capitalization at December 31, 2014 was $31.19 billion, $43 million higher than at December 31, 2013, primarily reflecting the impact of net
income of $3.69 billion and an increase in net unrealized appreciation of investments, partially offset by common share repurchases totaling
$3.28 billion under the Company's share repurchase authorization and shareholder dividends of $735 million.
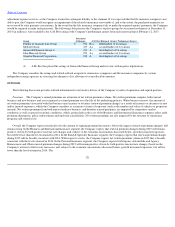
The following table provides a reconciliation of total capitalization excluding net unrealized gains on investments to total capitalization
presented in the foregoing table.
The debt
-
to
-
total capital ratio excluding net unrealized gain on investments is calculated by dividing (a) debt by (b) total capitalization
excluding net unrealized gains and losses on investments, net of taxes. Net unrealized gains and losses on investments can be significantly
impacted by both interest rate movements and other economic factors. Accordingly, in the opinion of the Company's management, the debt
-
to
-
total
capital ratio calculated on this basis provides another useful metric for investors to understand the Company's financial leverage position. The
Company's ratio of debt
-
to
-
total capital (excluding after
-
tax net unrealized investment gains) of 21.7% at December 31, 2014 was within the
Company's target range of 15% to 25%.
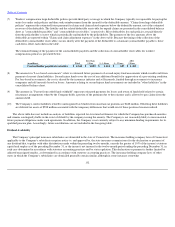
Credit Agreement. The Company is a party to a five
-
year, $1.0 billion revolving credit agreement with a syndicate of financial institutions that
expires in June 2018. Terms of the credit agreement are discussed in more detail in note 8 of notes to the Company's consolidated financial
statements.
Shelf Registration. The Company has filed with the Securities and Exchange Commission a universal shelf registration statement for the
potential offering and sale of securities. The Company may offer these securities from time to time at prices and on other terms to be determined at
the time of offering.
Share Repurchase Authorization. At December 31, 2014, the Company had $1.48 billion of capacity remaining under its share repurchase
authorization approved by the board of directors.
Contractual Obligations
The following table summarizes, as of December 31, 2014, the Company's future payments under contractual obligations and estimated claims
and claim
-
related payments. The table excludes short
-
term liabilities and includes only obligations at December 31, 2014 that are expected to be
settled in cash.
The table below includes the amount and estimated future timing of claims and claim
-
related payments. The amounts do not represent the exact
liability, but instead represent estimates, generally utilizing actuarial projections techniques, at a given accounting date. These estimates include
expectations of what the ultimate settlement and administration of claims will cost based on the Company's assessment of facts and circumstances
known, review of historical settlement patterns, estimates of trends in claims severity, frequency, legal theories of liability and other factors.
Variables in the reserve estimation process can be affected by both internal and external events, such as changes in claims handling procedures,
economic inflation or deflation, legal trends and legislative changes. Many of these items are not directly quantifiable, particularly on a prospective
basis. Additionally, there may
129
(at December 31, dollars in millions)
2014
2013
Total capitalization excluding net unrealized gains on investments
$
29,219
$
29,820
Net unrealized gain on investments, net of taxes
1,966
1,322
Total capitalization
$
31,185
$
31,142
Debt
-
to
-
total capital ratio
20.4
%
20.4
%
Debt
-
to
-
total capital ratio excluding net unrealized gains on investments
21.7
%
21.3
%