Travelers 2014 Annual Report Download - page 88
Download and view the complete annual report
Please find page 88 of the 2014 Travelers annual report below. You can navigate through the pages in the report by either clicking on the pages listed below, or by using the keyword search tool below to find specific information within the annual report.-
 1
1 -
2
-
3
-
4
-
5
-
6
-
7
-
8
-
9
-
10
-
11
-
12
-
13
-
14
-
15
-
16
-
17
-
18
-
19
-
20
-
21
-
22
-
23
-
24
-
25
-
26
-
27
-
28
-
29
-
30
-
31
-
32
-
33
-
34
-
35
-
36
-
37
-
38
-
39
-
40
-
41
-
42
-
43
-
44
-
45
-
46
-
47
-
48
-
49
-
50
-
51
-
52
-
53
-
54
-
55
-
56
-
57
-
58
-
59
-
60
-
61
-
62
-
63
-
64
-
65
-
66
-
67
-
68
-
69
-
70
-
71
-
72
-
73
-
74
-
75
-
76
-
77
-
 78
78 -
 79
79 -
 80
80 -
 81
81 -
 82
82 -
 83
83 -
 84
84 -
 85
85 -
 86
86 -
 87
87 -
 88
88 -
 89
89 -
 90
90 -
 91
91 -
 92
92 -
 93
93 -
 94
94 -
 95
95 -
 96
96 -
 97
97 -
 98
98 -
99
-
100
-
101
-
102
-
103
-
104
-
105
-
106
-
107
-
108
-
109
-
110
-
111
-
112
-
113
-
114
-
115
-
116
-
117
-
118
-
119
-
120
-
121
-
122
-
123
-
124
-
125
-
126
-
127
-
128
-
129
-
130
-
131
-
132
-
133
-
134
-
135
-
136
-
137
-
138
-
139
-
140
-
141
-
142
-
143
-
144
-
145
-
146
-
147
-
148
-
149
-
150
-
151
-
152
-
153
-
154
-
155
-
156
-
157
-
158
-
159
-
160
-
161
-
162
-
163
-
164
-
165
-
166
-
167
-
168
-
169
-
170
-
171
-
172
-
173
-
174
-
175
-
176
-
177
-
178
-
179
-
180
-
181
-
182
-
183
-
184
-
185
-
186
-
187
-
188
-
189
-
190
-
191
-
192
-
193
-
194
-
195
-
196
-
197
-
198
-
199
-
200
-
201
-
202
-
203
-
204
-
205
-
206
-
207
-
208
-
209
-
210
-
211
-
212
-
213
-
214
-
215
-
216
-
217
-
218
-
219
-
220
-
221
-
222
-
223
-
224
-
225
-
226
-
227
-
228
-
229
-
230
-
231
-
232
-
233
-
234
-
235
-
236
-
237
-
238
-
239
-
240
-
241
-
242
-
243
-
244
-
245
-
246
-
247
-
248
-
249
-
250
-
251
-
252
-
253
-
254
-
255
-
256
-
257
-
258
-
259
-
260
-
261
-
262
-
263
-
264
-
265
-
266
-
267
-
268
-
269
-
270
-
271
-
272
-
273
-
274
-
275
-
276
-
277
-
278
-
279
-
280
-
281
-
282
-
283
-
284
-
285
-
286
-
287
-
288
-
289
-
290
-
291
-
292
-
293
-
294
-
295
-
296
-
297
-
298
-
299
-
300
-
301
-
302
-
303
-
304
-
305
-
306
-
307
-
308
-
309
-
310
-
311
-
312
-
313
-
314
-
315
-
316
-
317
-
318
-
319
-
320
-
321
-
322
-
323
-
324
-
325
-
326
-
327
-
328
-
329
-
330
-
331
-
332
-
333
-
334
-
335
-
336
-
337
-
338
-
339
-
340
-
341
-
342
-
343
-
344
-
345
-
346
-
347
-
348
-
349
-
350
-
351
-
352
-
353
-
354
-
355
-
356
-
357
-
358
-
359
-
360
-
361
-
362
-
363
-
364
-
365
-
366
 |
 |

Table of Contents
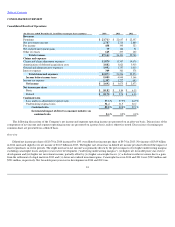
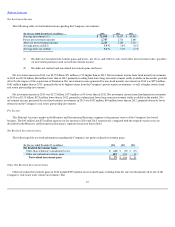
The combined ratio of 89.8% in 2013 was 7.3 points lower than the combined ratio of 97.1% in 2012.
The loss and loss adjustment expense ratio of 57.9% in 2013 was 7.0 points lower than the loss and loss adjustment expense ratio of 64.9% in
2012. Catastrophe losses accounted for 2.6 points and 8.3 points of the 2013 and 2012 loss and loss adjustment expense ratios, respectively. Net
favorable prior year reserve development in 2013 and 2012 provided 3.7 points and 4.2 points of benefit, respectively, to the loss and loss
adjustment expense ratio. The 2013 underlying loss and loss adjustment expense ratio was 1.8 points lower than the 2012 ratio on the same basis,
primarily reflecting the impact of earned pricing that exceeded loss cost trends in each of the Company's business segments.
The underwriting expense ratio of 31.9% in 2013 was lower than the underwriting expense ratio of 32.2% in 2012, primarily reflecting the impact
of growth in earned premiums in 2013.
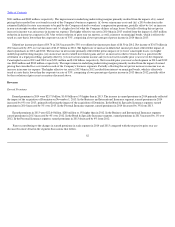
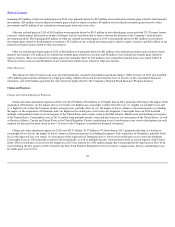
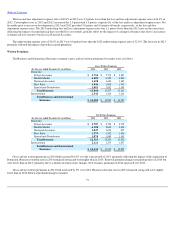
Written Premiums
Consolidated gross and net written premiums were as follows:
Gross and net written premiums in 2014 increased by 4% and 5%, respectively, over 2013, primarily reflecting the impact of the acquisition of
Dominion. Gross and net written premiums in 2013 both increased by 1% over 2012. Factors contributing to the changes in gross and net written
premiums in each segment in 2014 and 2013 as compared with the respective prior year are discussed in more detail in the segment discussions that
follow.
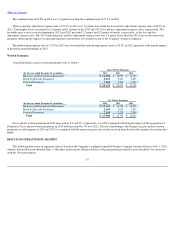
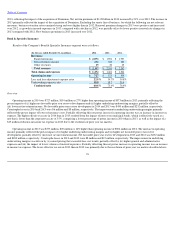
RESULTS OF OPERATIONS BY SEGMENT
The following discussion of segment results is based on the Company's realigned reportable business segment structure effective July 1, 2014,
which is discussed in more detail in Item 1—Business in this report. Financial data for all prior periods presented was reclassified to be consistent
with the 2014 presentation.
87
Gross Written Premiums
(for the year ended December 31, in millions)
2014
2013
2012
Business and International Insurance
$
16,202
$
14,992
$
14,327
Bond & Specialty Insurance
2,165
2,131
2,059
Personal Insurance
7,265
7,534
7,923
Total
$
25,632
$
24,657
$
24,309
Net Written Premiums
(for the year ended December 31, in millions)
2014
2013
2012
Business and International Insurance
$
14,636
$
13,512
$
12,929
Bond & Specialty Insurance
2,103
2,030
1,924
Personal Insurance
7,165
7,225
7,594
Total
$
23,904
$
22,767
$
22,447