Travelers 2014 Annual Report Download - page 97
Download and view the complete annual report
Please find page 97 of the 2014 Travelers annual report below. You can navigate through the pages in the report by either clicking on the pages listed below, or by using the keyword search tool below to find specific information within the annual report.-
 1
1 -
2
-
3
-
4
-
5
-
6
-
7
-
8
-
9
-
10
-
11
-
12
-
13
-
14
-
15
-
16
-
17
-
18
-
19
-
20
-
21
-
22
-
23
-
24
-
25
-
26
-
27
-
28
-
29
-
30
-
31
-
32
-
33
-
34
-
35
-
36
-
37
-
38
-
39
-
40
-
41
-
42
-
43
-
44
-
45
-
46
-
47
-
48
-
49
-
50
-
51
-
52
-
53
-
54
-
55
-
56
-
57
-
58
-
59
-
60
-
61
-
62
-
63
-
64
-
65
-
66
-
67
-
68
-
69
-
70
-
71
-
72
-
73
-
74
-
75
-
76
-
77
-
78
-
79
-
80
-
81
-
82
-
83
-
84
-
85
-
86
-
 87
87 -
 88
88 -
 89
89 -
 90
90 -
 91
91 -
 92
92 -
 93
93 -
 94
94 -
 95
95 -
 96
96 -
 97
97 -
 98
98 -
 99
99 -
 100
100 -
 101
101 -
 102
102 -
 103
103 -
 104
104 -
 105
105 -
 106
106 -
 107
107 -
108
-
109
-
110
-
111
-
112
-
113
-
114
-
115
-
116
-
117
-
118
-
119
-
120
-
121
-
122
-
123
-
124
-
125
-
126
-
127
-
128
-
129
-
130
-
131
-
132
-
133
-
134
-
135
-
136
-
137
-
138
-
139
-
140
-
141
-
142
-
143
-
144
-
145
-
146
-
147
-
148
-
149
-
150
-
151
-
152
-
153
-
154
-
155
-
156
-
157
-
158
-
159
-
160
-
161
-
162
-
163
-
164
-
165
-
166
-
167
-
168
-
169
-
170
-
171
-
172
-
173
-
174
-
175
-
176
-
177
-
178
-
179
-
180
-
181
-
182
-
183
-
184
-
185
-
186
-
187
-
188
-
189
-
190
-
191
-
192
-
193
-
194
-
195
-
196
-
197
-
198
-
199
-
200
-
201
-
202
-
203
-
204
-
205
-
206
-
207
-
208
-
209
-
210
-
211
-
212
-
213
-
214
-
215
-
216
-
217
-
218
-
219
-
220
-
221
-
222
-
223
-
224
-
225
-
226
-
227
-
228
-
229
-
230
-
231
-
232
-
233
-
234
-
235
-
236
-
237
-
238
-
239
-
240
-
241
-
242
-
243
-
244
-
245
-
246
-
247
-
248
-
249
-
250
-
251
-
252
-
253
-
254
-
255
-
256
-
257
-
258
-
259
-
260
-
261
-
262
-
263
-
264
-
265
-
266
-
267
-
268
-
269
-
270
-
271
-
272
-
273
-
274
-
275
-
276
-
277
-
278
-
279
-
280
-
281
-
282
-
283
-
284
-
285
-
286
-
287
-
288
-
289
-
290
-
291
-
292
-
293
-
294
-
295
-
296
-
297
-
298
-
299
-
300
-
301
-
302
-
303
-
304
-
305
-
306
-
307
-
308
-
309
-
310
-
311
-
312
-
313
-
314
-
315
-
316
-
317
-
318
-
319
-
320
-
321
-
322
-
323
-
324
-
325
-
326
-
327
-
328
-
329
-
330
-
331
-
332
-
333
-
334
-
335
-
336
-
337
-
338
-
339
-
340
-
341
-
342
-
343
-
344
-
345
-
346
-
347
-
348
-
349
-
350
-
351
-
352
-
353
-
354
-
355
-
356
-
357
-
358
-
359
-
360
-
361
-
362
-
363
-
364
-
365
-
366
 |
 |

Table of Contents
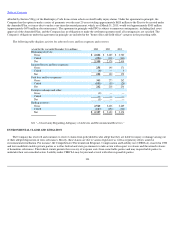
Net written premiums in 2014 were $2.10 billion, $73 million or 4% higher than in 2013, primarily driven by lower reinsurance costs that resulted
from the Company's decision to eliminate a management liability excess
-
of
-
loss reinsurance treaty and higher contract surety premium volume.
Excluding the surety line of business, for which the following are not relevant measures, business retention rates in 2014 remained strong and were
slightly higher than in 2013. Renewal premium changes in 2014 remained positive, although lower than in 2013, driven by renewal rate changes. New
business premiums in 2014 decreased from 2013.
Net written premiums in 2013 were $2.03 billion, $106 million or 6% higher than in 2012, primarily driven by higher contract surety volume, rate
increases in the management liability business and lower reinsurance costs primarily resulting from a change in a reinsurance treaty. Excluding the
surety line of business, for which the following are not relevant measures, business retention rates in 2013 remained strong but were lower than in
2012. Renewal premium changes in 2013 remained positive and were higher than in 2012, as increases in renewal rate changes were largely offset by
a decline in insured exposures. Renewal rate changes exceeded expected loss cost trends in 2013. New business premiums in 2013 decreased from
2012.
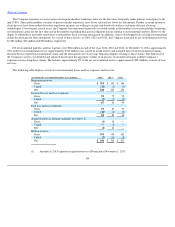
Personal Insurance
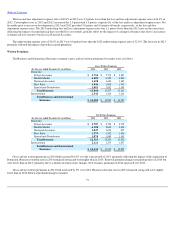
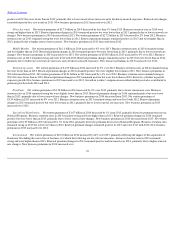
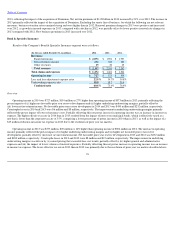
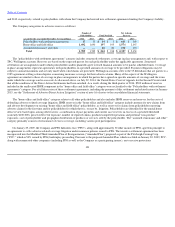
Results of the Company's Personal Insurance segment were as follows:
Overview
Operating income in 2014 was $824 million, $14 million or 2% lower than operating income of $838 million in 2013. The decrease in operating
income primarily reflected the pretax impacts of (i) an increase in catastrophe losses, (ii) lower net favorable prior year reserve development and
(iii) a decline in other revenues, partially offset by (iv) higher underlying underwriting margins and (v) higher net investment income. Catastrophe
losses in 2014 and 2013 were $336 million and $250 million, respectively. Net favorable prior year reserve development in 2014 and 2013 was
$169 million and $209 million, respectively. The improvement in underlying underwriting margins primarily reflected (i) earned pricing that exceeded
loss cost trends and (ii) the benefit of the Company's previously announced expense reduction initiatives, partially offset by (iii) the impact of a
higher mix of new business versus renewal business. Income tax expense in 2014 was level with 2013. The higher effective tax rate in 2014 than in
2013 primarily resulted from the impact of a $5 million reduction in income tax expense in 2013 due to the resolution of prior year tax matters.
96
(for the year ended December 31, in millions)
2014
2013
2012
Revenues:
Earned premiums
$
7,125
$
7,324
$
7,621
Net investment income
379
369
404
Other revenues
80
103
66
Total revenues
$
7,584
$
7,796
$
8,091
Total claims and expenses
$
6,394
$
6,592
$
7,842
Operating income
$
824
$
838
$
217
Loss and loss adjustment expense ratio
59.6
%
59.1
%
72.3
%
Underwriting expense ratio
29.1
29.8
29.6
Combined ratio
88.7
%
88.9
%
101.9
%
Incremental impact of direct to consumer initiative on combined
ratio
1.7
%
1.8
%
2.3
%