Travelers 2014 Annual Report Download - page 92
Download and view the complete annual report
Please find page 92 of the 2014 Travelers annual report below. You can navigate through the pages in the report by either clicking on the pages listed below, or by using the keyword search tool below to find specific information within the annual report.-
 1
1 -
2
-
3
-
4
-
5
-
6
-
7
-
8
-
9
-
10
-
11
-
12
-
13
-
14
-
15
-
16
-
17
-
18
-
19
-
20
-
21
-
22
-
23
-
24
-
25
-
26
-
27
-
28
-
29
-
30
-
31
-
32
-
33
-
34
-
35
-
36
-
37
-
38
-
39
-
40
-
41
-
42
-
43
-
44
-
45
-
46
-
47
-
48
-
49
-
50
-
51
-
52
-
53
-
54
-
55
-
56
-
57
-
58
-
59
-
60
-
61
-
62
-
63
-
64
-
65
-
66
-
67
-
68
-
69
-
70
-
71
-
72
-
73
-
74
-
75
-
76
-
77
-
78
-
79
-
80
-
81
-
 82
82 -
 83
83 -
 84
84 -
 85
85 -
 86
86 -
 87
87 -
 88
88 -
 89
89 -
 90
90 -
 91
91 -
 92
92 -
 93
93 -
 94
94 -
 95
95 -
 96
96 -
 97
97 -
 98
98 -
 99
99 -
 100
100 -
 101
101 -
 102
102 -
103
-
104
-
105
-
106
-
107
-
108
-
109
-
110
-
111
-
112
-
113
-
114
-
115
-
116
-
117
-
118
-
119
-
120
-
121
-
122
-
123
-
124
-
125
-
126
-
127
-
128
-
129
-
130
-
131
-
132
-
133
-
134
-
135
-
136
-
137
-
138
-
139
-
140
-
141
-
142
-
143
-
144
-
145
-
146
-
147
-
148
-
149
-
150
-
151
-
152
-
153
-
154
-
155
-
156
-
157
-
158
-
159
-
160
-
161
-
162
-
163
-
164
-
165
-
166
-
167
-
168
-
169
-
170
-
171
-
172
-
173
-
174
-
175
-
176
-
177
-
178
-
179
-
180
-
181
-
182
-
183
-
184
-
185
-
186
-
187
-
188
-
189
-
190
-
191
-
192
-
193
-
194
-
195
-
196
-
197
-
198
-
199
-
200
-
201
-
202
-
203
-
204
-
205
-
206
-
207
-
208
-
209
-
210
-
211
-
212
-
213
-
214
-
215
-
216
-
217
-
218
-
219
-
220
-
221
-
222
-
223
-
224
-
225
-
226
-
227
-
228
-
229
-
230
-
231
-
232
-
233
-
234
-
235
-
236
-
237
-
238
-
239
-
240
-
241
-
242
-
243
-
244
-
245
-
246
-
247
-
248
-
249
-
250
-
251
-
252
-
253
-
254
-
255
-
256
-
257
-
258
-
259
-
260
-
261
-
262
-
263
-
264
-
265
-
266
-
267
-
268
-
269
-
270
-
271
-
272
-
273
-
274
-
275
-
276
-
277
-
278
-
279
-
280
-
281
-
282
-
283
-
284
-
285
-
286
-
287
-
288
-
289
-
290
-
291
-
292
-
293
-
294
-
295
-
296
-
297
-
298
-
299
-
300
-
301
-
302
-
303
-
304
-
305
-
306
-
307
-
308
-
309
-
310
-
311
-
312
-
313
-
314
-
315
-
316
-
317
-
318
-
319
-
320
-
321
-
322
-
323
-
324
-
325
-
326
-
327
-
328
-
329
-
330
-
331
-
332
-
333
-
334
-
335
-
336
-
337
-
338
-
339
-
340
-
341
-
342
-
343
-
344
-
345
-
346
-
347
-
348
-
349
-
350
-
351
-
352
-
353
-
354
-
355
-
356
-
357
-
358
-
359
-
360
-
361
-
362
-
363
-
364
-
365
-
366
 |
 |

Table of Contents
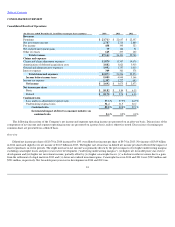
The loss and loss adjustment expense ratio of 60.8% in 2013 was 3.5 points lower than the loss and loss adjustment expense ratio of 64.3% in
2012. Catastrophe losses in 2013 and 2012 accounted for 2.5 points and 6.5 points, respectively, of the loss and loss adjustment expense ratio. Net
favorable prior year reserve development in 2013 and 2012 provided 3.0 points and 4.6 points of benefit, respectively, to the loss and loss
adjustment expense ratio. The 2013 underlying loss and loss adjustment expense ratio was 1.1 points lower than the 2012 ratio on the same basis,
reflecting the impact of earned pricing that exceeded loss cost trends, partially offset by the impact of a change in business mix due to an increase
in longer
-
tail loss
-
sensitive business in National Accounts.
The underwriting expense ratio of 32.0% in 2013 was 0.8 points lower than the 2012 underwriting expense ratio of 32.8%. The decrease in 2013
primarily reflected the impact of growth in earned premiums.
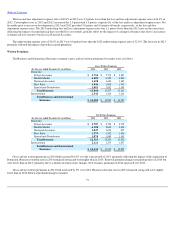
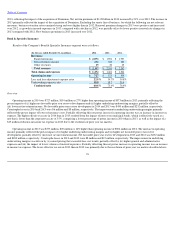
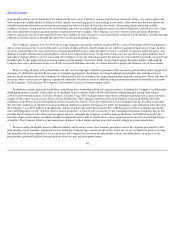
Written Premiums
The Business and International Insurance segment's gross and net written premiums by market were as follows:
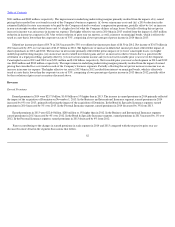
Gross and net written premiums in 2014 both increased by 8% over the same period of 2013, primarily reflecting the impact of the acquisition of
Dominion. Business retention rates in 2014 remained strong and were higher than in 2013. Renewal premium changes remained positive in 2014 but
were lower than in 2013, primarily due to a decline in renewal rate changes. New business premiums in 2014 increased over 2013.
Gross and net written premiums in 2013 both increased by 5% over 2012. Business retention rates in 2013 remained strong and were slightly
lower than in 2012. Renewal premium changes remained
91
Gross Written Premiums
(for the year ended December 31, in millions)
2014
2013
2012
Domestic:
Select Accounts
$
2,754
$
2,774
$
2,827
Middle Market
6,489
6,250
6,045
National Accounts
1,690
1,606
1,387
First Party
1,846
1,855
1,743
Specialized Distribution
1,081
1,092
1,109
Total Domestic
13,860
13,577
13,111
International
2,342
1,415
1,216
Total Business and International
Insurance
$
16,202
$
14,992
$
14,327
Net Written Premiums
(for the year ended December 31, in millions)
2014
2013
2012
Domestic:
Select Accounts
$
2,707
$
2,724
$
2,775
Middle Market
6,108
5,862
5,654
National Accounts
1,047
1,010
907
First Party
1,579
1,552
1,436
Specialized Distribution
1,074
1,085
1,100
Total Domestic
12,515
12,233
11,872
International
2,121
1,279
1,057
Total Business and International
Insurance
$
14,636
$
13,512
$
12,929