Travelers 2014 Annual Report Download - page 83
Download and view the complete annual report
Please find page 83 of the 2014 Travelers annual report below. You can navigate through the pages in the report by either clicking on the pages listed below, or by using the keyword search tool below to find specific information within the annual report.-
 1
1 -
2
-
3
-
4
-
5
-
6
-
7
-
8
-
9
-
10
-
11
-
12
-
13
-
14
-
15
-
16
-
17
-
18
-
19
-
20
-
21
-
22
-
23
-
24
-
25
-
26
-
27
-
28
-
29
-
30
-
31
-
32
-
33
-
34
-
35
-
36
-
37
-
38
-
39
-
40
-
41
-
42
-
43
-
44
-
45
-
46
-
47
-
48
-
49
-
50
-
51
-
52
-
53
-
54
-
55
-
56
-
57
-
58
-
59
-
60
-
61
-
62
-
63
-
64
-
65
-
66
-
67
-
68
-
69
-
70
-
71
-
72
-
 73
73 -
 74
74 -
 75
75 -
 76
76 -
 77
77 -
 78
78 -
 79
79 -
 80
80 -
 81
81 -
 82
82 -
 83
83 -
 84
84 -
 85
85 -
 86
86 -
 87
87 -
 88
88 -
 89
89 -
 90
90 -
 91
91 -
 92
92 -
 93
93 -
94
-
95
-
96
-
97
-
98
-
99
-
100
-
101
-
102
-
103
-
104
-
105
-
106
-
107
-
108
-
109
-
110
-
111
-
112
-
113
-
114
-
115
-
116
-
117
-
118
-
119
-
120
-
121
-
122
-
123
-
124
-
125
-
126
-
127
-
128
-
129
-
130
-
131
-
132
-
133
-
134
-
135
-
136
-
137
-
138
-
139
-
140
-
141
-
142
-
143
-
144
-
145
-
146
-
147
-
148
-
149
-
150
-
151
-
152
-
153
-
154
-
155
-
156
-
157
-
158
-
159
-
160
-
161
-
162
-
163
-
164
-
165
-
166
-
167
-
168
-
169
-
170
-
171
-
172
-
173
-
174
-
175
-
176
-
177
-
178
-
179
-
180
-
181
-
182
-
183
-
184
-
185
-
186
-
187
-
188
-
189
-
190
-
191
-
192
-
193
-
194
-
195
-
196
-
197
-
198
-
199
-
200
-
201
-
202
-
203
-
204
-
205
-
206
-
207
-
208
-
209
-
210
-
211
-
212
-
213
-
214
-
215
-
216
-
217
-
218
-
219
-
220
-
221
-
222
-
223
-
224
-
225
-
226
-
227
-
228
-
229
-
230
-
231
-
232
-
233
-
234
-
235
-
236
-
237
-
238
-
239
-
240
-
241
-
242
-
243
-
244
-
245
-
246
-
247
-
248
-
249
-
250
-
251
-
252
-
253
-
254
-
255
-
256
-
257
-
258
-
259
-
260
-
261
-
262
-
263
-
264
-
265
-
266
-
267
-
268
-
269
-
270
-
271
-
272
-
273
-
274
-
275
-
276
-
277
-
278
-
279
-
280
-
281
-
282
-
283
-
284
-
285
-
286
-
287
-
288
-
289
-
290
-
291
-
292
-
293
-
294
-
295
-
296
-
297
-
298
-
299
-
300
-
301
-
302
-
303
-
304
-
305
-
306
-
307
-
308
-
309
-
310
-
311
-
312
-
313
-
314
-
315
-
316
-
317
-
318
-
319
-
320
-
321
-
322
-
323
-
324
-
325
-
326
-
327
-
328
-
329
-
330
-
331
-
332
-
333
-
334
-
335
-
336
-
337
-
338
-
339
-
340
-
341
-
342
-
343
-
344
-
345
-
346
-
347
-
348
-
349
-
350
-
351
-
352
-
353
-
354
-
355
-
356
-
357
-
358
-
359
-
360
-
361
-
362
-
363
-
364
-
365
-
366
 |
 |

Table of Contents
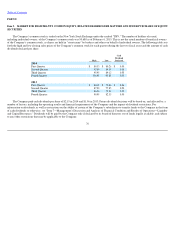
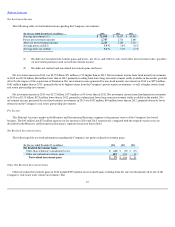
$941 million and $840 million, respectively. The improvement in underlying underwriting margins primarily resulted from the impacts of (i) earned
pricing that exceeded loss cost trends in each of the Company's business segments, (ii) lower reinsurance costs and (iii) a 2014 reduction in the
estimated liability for state assessments to be paid by the Company related to workers' compensation premiums, partially offset by (iv) an increase
in non
-
catastrophe weather
-
related losses and (v) a higher level of what the Company defines as large losses. Partially offsetting this net pretax
increase in income was an increase in income tax expense. The higher effective tax rate in 2014 than in 2013 resulted from the impact of a $63 million
reduction in income tax expense in 2013 due to the resolution of prior year tax matters, as well as interest on municipal bonds, which is effectively
taxed at a rate that is lower than the corporate tax rate of 35%, comprising a lower percentage of pretax income in 2014 than in 2013.
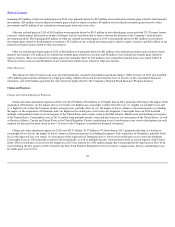
Diluted net income per share of $9.74 in 2013 increased by 55% over diluted net income per share of $6.30 in 2012. Net income of $3.67 billion in
2013 increased by 49% over net income of $2.47 billion in 2012. The higher rate of increase in diluted net income per share reflected the impact of
share repurchases in 2013 and 2012. The increase in net income primarily reflected the pretax impacts of (i) lower catastrophe losses, (ii) higher
underlying underwriting margins, (iii) an increase in net realized investment gains and (iv) an increase in other revenues due to a gain from the
settlement of a legal proceeding, partially offset by (v) lower net investment income and (vi) lower net favorable prior year reserve development.
Catastrophe losses in 2013 and 2012 were $591 million and $1.86 billion, respectively. Net favorable prior year reserve development in 2013 and 2012
was $840 million and $940 million, respectively. The improvement in underlying underwriting margins primarily resulted from the impact of earned
pricing that exceeded loss cost trends in each of the Company's business segments. Partially offsetting this net pretax increase in income was an
increase in income tax expense. The higher effective tax rate in 2013 than in 2012 resulted from interest on municipal bonds, which is effectively
taxed at a rate that is lower than the corporate tax rate of 35%, comprising a lower percentage of pretax income in 2013 than in 2012, partially offset
by the resolution of prior year tax matters discussed above.
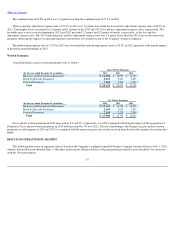
Revenues
Earned Premiums
Earned premiums in 2014 were $23.71 billion, $1.08 billion or 5% higher than in 2013. The increase in earned premiums in 2014 primarily reflected
the impact of the acquisition of Dominion on November 1, 2013. In the Business and International Insurance segment, earned premiums in 2014
increased by 9% over 2013, primarily reflecting the impact of the acquisition of Dominion. In the Bond & Specialty Insurance segment, earned
premiums in 2014 increased by 5% over 2013. In the Personal Insurance segment, earned premiums in 2014 decreased by 3% from 2013.
Earned premiums in 2013 were $22.64 billion, $280 million or 1% higher than in 2012. In the Business and International Insurance segment,
earned premiums in 2013 increased by 4% over 2012. In the Bond & Specialty Insurance segment, earned premiums in 2013 increased by 1% over
2012. In the Personal Insurance segment, earned premiums in 2013 decreased by 4% from 2012.
Factors contributing to the changes in earned premiums in each segment in 2014 and 2013 compared with the respective prior year are
discussed in more detail in the segment discussions that follow.
82