Travelers 2014 Annual Report Download - page 89
Download and view the complete annual report
Please find page 89 of the 2014 Travelers annual report below. You can navigate through the pages in the report by either clicking on the pages listed below, or by using the keyword search tool below to find specific information within the annual report.-
 1
1 -
2
-
3
-
4
-
5
-
6
-
7
-
8
-
9
-
10
-
11
-
12
-
13
-
14
-
15
-
16
-
17
-
18
-
19
-
20
-
21
-
22
-
23
-
24
-
25
-
26
-
27
-
28
-
29
-
30
-
31
-
32
-
33
-
34
-
35
-
36
-
37
-
38
-
39
-
40
-
41
-
42
-
43
-
44
-
45
-
46
-
47
-
48
-
49
-
50
-
51
-
52
-
53
-
54
-
55
-
56
-
57
-
58
-
59
-
60
-
61
-
62
-
63
-
64
-
65
-
66
-
67
-
68
-
69
-
70
-
71
-
72
-
73
-
74
-
75
-
76
-
77
-
78
-
 79
79 -
 80
80 -
 81
81 -
 82
82 -
 83
83 -
 84
84 -
 85
85 -
 86
86 -
 87
87 -
 88
88 -
 89
89 -
 90
90 -
 91
91 -
 92
92 -
 93
93 -
 94
94 -
 95
95 -
 96
96 -
 97
97 -
 98
98 -
 99
99 -
100
-
101
-
102
-
103
-
104
-
105
-
106
-
107
-
108
-
109
-
110
-
111
-
112
-
113
-
114
-
115
-
116
-
117
-
118
-
119
-
120
-
121
-
122
-
123
-
124
-
125
-
126
-
127
-
128
-
129
-
130
-
131
-
132
-
133
-
134
-
135
-
136
-
137
-
138
-
139
-
140
-
141
-
142
-
143
-
144
-
145
-
146
-
147
-
148
-
149
-
150
-
151
-
152
-
153
-
154
-
155
-
156
-
157
-
158
-
159
-
160
-
161
-
162
-
163
-
164
-
165
-
166
-
167
-
168
-
169
-
170
-
171
-
172
-
173
-
174
-
175
-
176
-
177
-
178
-
179
-
180
-
181
-
182
-
183
-
184
-
185
-
186
-
187
-
188
-
189
-
190
-
191
-
192
-
193
-
194
-
195
-
196
-
197
-
198
-
199
-
200
-
201
-
202
-
203
-
204
-
205
-
206
-
207
-
208
-
209
-
210
-
211
-
212
-
213
-
214
-
215
-
216
-
217
-
218
-
219
-
220
-
221
-
222
-
223
-
224
-
225
-
226
-
227
-
228
-
229
-
230
-
231
-
232
-
233
-
234
-
235
-
236
-
237
-
238
-
239
-
240
-
241
-
242
-
243
-
244
-
245
-
246
-
247
-
248
-
249
-
250
-
251
-
252
-
253
-
254
-
255
-
256
-
257
-
258
-
259
-
260
-
261
-
262
-
263
-
264
-
265
-
266
-
267
-
268
-
269
-
270
-
271
-
272
-
273
-
274
-
275
-
276
-
277
-
278
-
279
-
280
-
281
-
282
-
283
-
284
-
285
-
286
-
287
-
288
-
289
-
290
-
291
-
292
-
293
-
294
-
295
-
296
-
297
-
298
-
299
-
300
-
301
-
302
-
303
-
304
-
305
-
306
-
307
-
308
-
309
-
310
-
311
-
312
-
313
-
314
-
315
-
316
-
317
-
318
-
319
-
320
-
321
-
322
-
323
-
324
-
325
-
326
-
327
-
328
-
329
-
330
-
331
-
332
-
333
-
334
-
335
-
336
-
337
-
338
-
339
-
340
-
341
-
342
-
343
-
344
-
345
-
346
-
347
-
348
-
349
-
350
-
351
-
352
-
353
-
354
-
355
-
356
-
357
-
358
-
359
-
360
-
361
-
362
-
363
-
364
-
365
-
366
 |
 |

Table of Contents
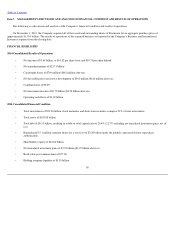
Business and International Insurance
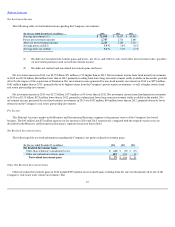
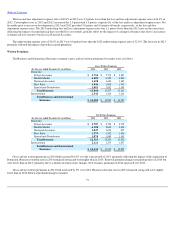
Results of the Company's Business and International Insurance segment were as follows:
Overview
Operating income in 2014 was $2.35 billion, $57 million or 2% lower than operating income of $2.40 billion in 2013. The decrease in operating
income in 2014 primarily reflected an increase in income taxes and a slight decrease in operating income before income taxes. The slight decrease in
operating income before income taxes reflected the pretax impacts of (i) lower net favorable prior year reserve development, (ii) a decline in other
revenues due to a gain from the settlement of a legal matter in 2013 and (iii) higher catastrophe losses, largely offset by (iv) higher underlying
underwriting margins and (v) an increase in net investment income. Catastrophe losses in 2014 and 2013 were $367 million and $333 million,
respectively. Net favorable prior year reserve development in 2014 and 2013 was $322 million and $399 million, respectively. The improvement in
underlying underwriting margins in 2014 primarily reflected (i) earned pricing that exceeded loss cost trends and (ii) a reduction in the estimated
liability for state assessments to be paid by the Company related to workers' compensation premiums, partially offset by (iii) higher non
-
catastrophe weather
-
related losses and (iv) a higher level of what the Company defines as large losses. The increase in income tax expense was
primarily due to the impact of a $43 million reduction in income tax expense in 2013 resulting from the resolution of prior year tax matters. The higher
effective tax rate in 2014 than in 2013 primarily resulted from the impact of the reduction in income tax expense in 2013 described above.
Operating income in 2013 was $2.40 billion, $423 million or 21% higher than operating income of $1.98 billion in 2012. The increase in operating
income primarily reflected the pretax impacts of (i) lower catastrophe losses, (ii) higher underlying underwriting margins and (iii) an increase in other
revenues due to a gain from the settlement of a legal matter, partially offset by (iv) lower net favorable prior year reserve development and (v) lower
net investment income. Catastrophe losses in 2013 and 2012 were $333 million and $829 million, respectively. Net favorable prior year reserve
development in 2013 and 2012 was $399 million and $585 million, respectively. Net favorable prior year reserve development in 2013 was reduced by
a $42 million charge that was precipitated by legislation in New York as described in the consolidated "Claims and Claim Adjustment Expenses"
section above. The improvement in underlying underwriting margins primarily resulted from the impact of earned pricing that exceeded loss cost
trends. Partially offsetting this net pretax increase in operating income was an increase in income tax expense. The higher effective tax rate in 2013
than in 2012 primarily resulted from the impact of interest on municipal bonds, which is effectively taxed at a rate that is lower than
88
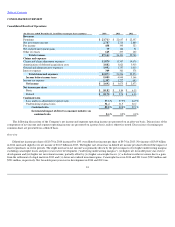
(for the year ended December 31, in millions)
2014
2013
2012
Revenues:
Earned premiums
$
14,512
$
13,332
$
12,779
Net investment income
2,156
2,087
2,205
Fee income
438
395
323
Other revenues
46
160
41
Total revenues
$
17,152
$
15,974
$
15,348
Total claims and expenses
$
14,007
$
12,812
$
12,787
Operating income
$
2,347
$
2,404
$
1,981
Loss and loss adjustment expense ratio
61.6
%
60.8
%
64.3
%
Underwriting expense ratio
31.5
32.0
32.8
Combined ratio
93.1
%
92.8
%
97.1
%