Travelers 2014 Annual Report Download - page 101
Download and view the complete annual report
Please find page 101 of the 2014 Travelers annual report below. You can navigate through the pages in the report by either clicking on the pages listed below, or by using the keyword search tool below to find specific information within the annual report.-
 1
1 -
2
-
3
-
4
-
5
-
6
-
7
-
8
-
9
-
10
-
11
-
12
-
13
-
14
-
15
-
16
-
17
-
18
-
19
-
20
-
21
-
22
-
23
-
24
-
25
-
26
-
27
-
28
-
29
-
30
-
31
-
32
-
33
-
34
-
35
-
36
-
37
-
38
-
39
-
40
-
41
-
42
-
43
-
44
-
45
-
46
-
47
-
48
-
49
-
50
-
51
-
52
-
53
-
54
-
55
-
56
-
57
-
58
-
59
-
60
-
61
-
62
-
63
-
64
-
65
-
66
-
67
-
68
-
69
-
70
-
71
-
72
-
73
-
74
-
75
-
76
-
77
-
78
-
79
-
80
-
81
-
82
-
83
-
84
-
85
-
86
-
87
-
88
-
89
-
90
-
 91
91 -
 92
92 -
 93
93 -
 94
94 -
 95
95 -
 96
96 -
 97
97 -
 98
98 -
 99
99 -
 100
100 -
 101
101 -
 102
102 -
 103
103 -
 104
104 -
 105
105 -
 106
106 -
 107
107 -
 108
108 -
 109
109 -
 110
110 -
 111
111 -
112
-
113
-
114
-
115
-
116
-
117
-
118
-
119
-
120
-
121
-
122
-
123
-
124
-
125
-
126
-
127
-
128
-
129
-
130
-
131
-
132
-
133
-
134
-
135
-
136
-
137
-
138
-
139
-
140
-
141
-
142
-
143
-
144
-
145
-
146
-
147
-
148
-
149
-
150
-
151
-
152
-
153
-
154
-
155
-
156
-
157
-
158
-
159
-
160
-
161
-
162
-
163
-
164
-
165
-
166
-
167
-
168
-
169
-
170
-
171
-
172
-
173
-
174
-
175
-
176
-
177
-
178
-
179
-
180
-
181
-
182
-
183
-
184
-
185
-
186
-
187
-
188
-
189
-
190
-
191
-
192
-
193
-
194
-
195
-
196
-
197
-
198
-
199
-
200
-
201
-
202
-
203
-
204
-
205
-
206
-
207
-
208
-
209
-
210
-
211
-
212
-
213
-
214
-
215
-
216
-
217
-
218
-
219
-
220
-
221
-
222
-
223
-
224
-
225
-
226
-
227
-
228
-
229
-
230
-
231
-
232
-
233
-
234
-
235
-
236
-
237
-
238
-
239
-
240
-
241
-
242
-
243
-
244
-
245
-
246
-
247
-
248
-
249
-
250
-
251
-
252
-
253
-
254
-
255
-
256
-
257
-
258
-
259
-
260
-
261
-
262
-
263
-
264
-
265
-
266
-
267
-
268
-
269
-
270
-
271
-
272
-
273
-
274
-
275
-
276
-
277
-
278
-
279
-
280
-
281
-
282
-
283
-
284
-
285
-
286
-
287
-
288
-
289
-
290
-
291
-
292
-
293
-
294
-
295
-
296
-
297
-
298
-
299
-
300
-
301
-
302
-
303
-
304
-
305
-
306
-
307
-
308
-
309
-
310
-
311
-
312
-
313
-
314
-
315
-
316
-
317
-
318
-
319
-
320
-
321
-
322
-
323
-
324
-
325
-
326
-
327
-
328
-
329
-
330
-
331
-
332
-
333
-
334
-
335
-
336
-
337
-
338
-
339
-
340
-
341
-
342
-
343
-
344
-
345
-
346
-
347
-
348
-
349
-
350
-
351
-
352
-
353
-
354
-
355
-
356
-
357
-
358
-
359
-
360
-
361
-
362
-
363
-
364
-
365
-
366
 |
 |

Table of Contents
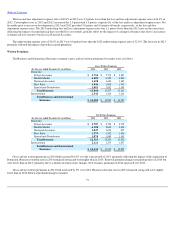
In 2014, net written premiums in the Agency Homeowners and Other line of business were 2% lower than 2013 as a result of ongoing
underwriting actions taken in response to the severe weather events that have occurred over the last several years, including seeking improved
rates where the Company believes it is appropriate, as well as improved terms and conditions. Business retention rates remained strong in 2014 and
were higher than in 2013. Renewal premium changes in 2014 remained positive but were lower than in 2013, primarily due to lower renewal rate
changes. New business premiums in 2014 were higher than in 2013. In 2013 in the Agency Homeowners and Other line of business, net written
premiums were 3% lower than in 2012 as a result of the ongoing underwriting actions described above. Business retention rates remained strong
but were lower than in 2012. Renewal premium changes in 2013 remained positive but were lower than in 2012. New business premiums in 2013
decreased from 2012.
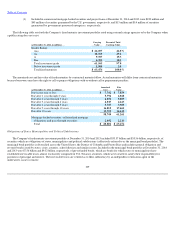
For its Agency business, the Personal Insurance segment had approximately 6.0 million and 6.2 million active policies at December 31, 2014 and
2013, respectively.
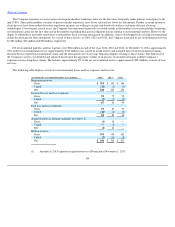
Direct to Consumer Written Premiums
In its direct to consumer business, net written premiums in 2014 were $187 million, $25 million or 15% higher than in 2013. In 2014, automobile
net written premiums increased by $18 million or 16% over 2013, and homeowners and other net written premiums increased by $7 million or 14%
over 2013. Net written premiums in 2013 were $162 million, $4 million or 3% higher than in 2012. In 2013, homeowners and other net written premiums
increased by $7 million, or 16% over 2012, partially offset by a decline of $3 million, or 3%, in automobile net written premiums compared to 2012.
The direct to consumer business had 193,000 and 166,000 active policies at December 31, 2014 and 2013, respectively.
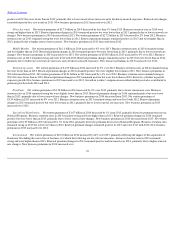
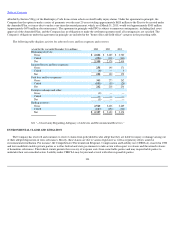
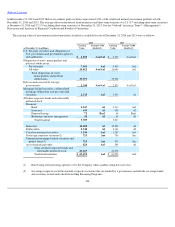
Interest Expense and Other
The operating loss for Interest Expense and Other in 2014 was $9 million higher than in 2013. The operating loss for Interest Expense and Other
in 2013 was $13 million lower than in 2012. After
-
tax interest expense in 2014, 2013 and 2012 was $240 million, $235 million and $246 million,
respectively. The increase in interest expense in 2014 compared with 2013 primarily reflected slightly higher average levels of debt outstanding. The
decrease in interest expense in 2013 compared with 2012 primarily reflected lower average levels of debt outstanding.
ASBESTOS CLAIMS AND LITIGATION
The Company believes that the property and casualty insurance industry has suffered from court decisions and other trends that have
expanded insurance coverage for asbestos claims far beyond the original intent of insurers and policyholders. The Company has received and
continues to receive a significant number of asbestos claims from the Company's policyholders (which includes others seeking coverage under a
policy). Factors underlying these claim filings include continued intensive advertising by lawyers seeking asbestos claimants and the continued
focus by plaintiffs on defendants who were not traditionally primary targets of asbestos litigation. The focus on these defendants is primarily the
result of the number of traditional asbestos defendants who have sought bankruptcy protection in previous years. In addition to contributing to
the overall number of claims, bankruptcy proceedings may increase the volatility of asbestos
-
related losses by initially delaying the reporting of
claims and later by significantly accelerating and increasing loss payments by insurers, including the Company. The bankruptcy of many traditional
defendants has also caused increased settlement demands against those
100
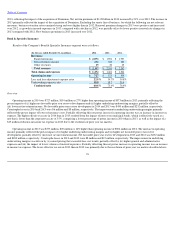
(for the year ended December 31, in millions)
2014
2013
2012
Operating loss
$
(257
)
$
(248
)
$
(261
)