Travelers 2014 Annual Report Download - page 95
Download and view the complete annual report
Please find page 95 of the 2014 Travelers annual report below. You can navigate through the pages in the report by either clicking on the pages listed below, or by using the keyword search tool below to find specific information within the annual report.-
 1
1 -
2
-
3
-
4
-
5
-
6
-
7
-
8
-
9
-
10
-
11
-
12
-
13
-
14
-
15
-
16
-
17
-
18
-
19
-
20
-
21
-
22
-
23
-
24
-
25
-
26
-
27
-
28
-
29
-
30
-
31
-
32
-
33
-
34
-
35
-
36
-
37
-
38
-
39
-
40
-
41
-
42
-
43
-
44
-
45
-
46
-
47
-
48
-
49
-
50
-
51
-
52
-
53
-
54
-
55
-
56
-
57
-
58
-
59
-
60
-
61
-
62
-
63
-
64
-
65
-
66
-
67
-
68
-
69
-
70
-
71
-
72
-
73
-
74
-
75
-
76
-
77
-
78
-
79
-
80
-
81
-
82
-
83
-
84
-
 85
85 -
 86
86 -
 87
87 -
 88
88 -
 89
89 -
 90
90 -
 91
91 -
 92
92 -
 93
93 -
 94
94 -
 95
95 -
 96
96 -
 97
97 -
 98
98 -
 99
99 -
 100
100 -
 101
101 -
 102
102 -
 103
103 -
 104
104 -
 105
105 -
106
-
107
-
108
-
109
-
110
-
111
-
112
-
113
-
114
-
115
-
116
-
117
-
118
-
119
-
120
-
121
-
122
-
123
-
124
-
125
-
126
-
127
-
128
-
129
-
130
-
131
-
132
-
133
-
134
-
135
-
136
-
137
-
138
-
139
-
140
-
141
-
142
-
143
-
144
-
145
-
146
-
147
-
148
-
149
-
150
-
151
-
152
-
153
-
154
-
155
-
156
-
157
-
158
-
159
-
160
-
161
-
162
-
163
-
164
-
165
-
166
-
167
-
168
-
169
-
170
-
171
-
172
-
173
-
174
-
175
-
176
-
177
-
178
-
179
-
180
-
181
-
182
-
183
-
184
-
185
-
186
-
187
-
188
-
189
-
190
-
191
-
192
-
193
-
194
-
195
-
196
-
197
-
198
-
199
-
200
-
201
-
202
-
203
-
204
-
205
-
206
-
207
-
208
-
209
-
210
-
211
-
212
-
213
-
214
-
215
-
216
-
217
-
218
-
219
-
220
-
221
-
222
-
223
-
224
-
225
-
226
-
227
-
228
-
229
-
230
-
231
-
232
-
233
-
234
-
235
-
236
-
237
-
238
-
239
-
240
-
241
-
242
-
243
-
244
-
245
-
246
-
247
-
248
-
249
-
250
-
251
-
252
-
253
-
254
-
255
-
256
-
257
-
258
-
259
-
260
-
261
-
262
-
263
-
264
-
265
-
266
-
267
-
268
-
269
-
270
-
271
-
272
-
273
-
274
-
275
-
276
-
277
-
278
-
279
-
280
-
281
-
282
-
283
-
284
-
285
-
286
-
287
-
288
-
289
-
290
-
291
-
292
-
293
-
294
-
295
-
296
-
297
-
298
-
299
-
300
-
301
-
302
-
303
-
304
-
305
-
306
-
307
-
308
-
309
-
310
-
311
-
312
-
313
-
314
-
315
-
316
-
317
-
318
-
319
-
320
-
321
-
322
-
323
-
324
-
325
-
326
-
327
-
328
-
329
-
330
-
331
-
332
-
333
-
334
-
335
-
336
-
337
-
338
-
339
-
340
-
341
-
342
-
343
-
344
-
345
-
346
-
347
-
348
-
349
-
350
-
351
-
352
-
353
-
354
-
355
-
356
-
357
-
358
-
359
-
360
-
361
-
362
-
363
-
364
-
365
-
366
 |
 |

Table of Contents
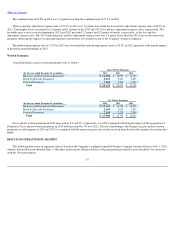
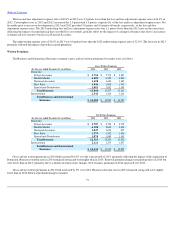
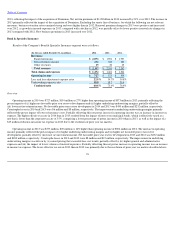
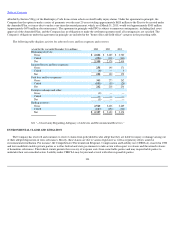
Revenues
Earned Premiums
Earned premiums in 2014 were $2.08 billion, $95 million or 5% higher than in 2013, primarily reflecting the impact of lower reinsurance costs.
Earned premiums in 2013 were $1.98 billion, $24 million or 1% higher than in 2012.
Net Investment Income
Net investment income in 2014 was $252 million, $8 million or 3% lower than in 2013. Net investment income in 2013 was $260 million, $20 million
or 7% lower than in 2012. Included in the Bond & Specialty Insurance segment are certain legal entities whose invested assets and related net
investment income are reported exclusively in this segment and not allocated among all business segments. As a result, reported net investment
income in the Bond & Specialty Insurance segment reflects a significantly smaller proportion of allocated net investment income, including that
from the Company's non
-
fixed maturity investments that experienced an increase in investment income in 2014 and a decrease in investment income
in 2013. Refer to the "Net Investment Income" section of the "Consolidated Results of Operations" discussion herein for a description of the
factors contributing to the changes in the Company's consolidated net investment income in 2014 and 2013 compared with the respective prior
years. In addition, refer to note 2 of notes to the Company's consolidated financial statements herein for a discussion of the Company's net
investment income allocation methodology.
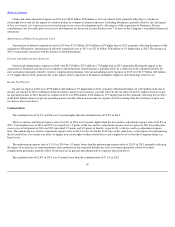
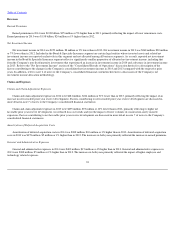
Claims and Expenses
Claims and Claim Adjustment Expenses
Claims and claim adjustment expenses in 2014 were $481 million, $214 million or 31% lower than in 2013, primarily reflecting the impact of an
increase in net favorable prior year reserve development. Factors contributing to net favorable prior year reserve development are discussed in
more detail in note 7 of notes to the Company's consolidated financial statements.
Claims and claim adjustment expenses in 2013 were $695 million, $93 million or 12% lower than in 2012, primarily reflecting (i) higher net
favorable prior year reserve development, (ii) reduced loss cost trends and (iii) the impact of lower volumes of construction surety insured
exposures. Factors contributing to net favorable prior year reserve development are discussed in more detail in note 7 of notes to the Company's
consolidated financial statements.
Amortization of Deferred Acquisition Costs
Amortization of deferred acquisition costs in 2014 was $388 million, $10 million or 3% higher than in 2013. Amortization of deferred acquisition
costs in 2013 was $378 million, $5 million or 1% higher than in 2012. The increases in both years primarily reflected the increase in earned premiums.
General and Administrative Expenses
General and administrative expenses in 2014 were $403 million, $15 million or 4% higher than in 2013. General and administrative expenses in
2013 were $388 million, $5 million or 1% higher than in 2012. The increases in both years primarily reflected the impact of higher employee and
technology related expenses.
94