Travelers 2014 Annual Report Download - page 82
Download and view the complete annual report
Please find page 82 of the 2014 Travelers annual report below. You can navigate through the pages in the report by either clicking on the pages listed below, or by using the keyword search tool below to find specific information within the annual report.-
 1
1 -
2
-
3
-
4
-
5
-
6
-
7
-
8
-
9
-
10
-
11
-
12
-
13
-
14
-
15
-
16
-
17
-
18
-
19
-
20
-
21
-
22
-
23
-
24
-
25
-
26
-
27
-
28
-
29
-
30
-
31
-
32
-
33
-
34
-
35
-
36
-
37
-
38
-
39
-
40
-
41
-
42
-
43
-
44
-
45
-
46
-
47
-
48
-
49
-
50
-
51
-
52
-
53
-
54
-
55
-
56
-
57
-
58
-
59
-
60
-
61
-
62
-
63
-
64
-
65
-
66
-
67
-
68
-
69
-
70
-
71
-
 72
72 -
 73
73 -
 74
74 -
 75
75 -
 76
76 -
 77
77 -
 78
78 -
 79
79 -
 80
80 -
 81
81 -
 82
82 -
 83
83 -
 84
84 -
 85
85 -
 86
86 -
 87
87 -
 88
88 -
 89
89 -
 90
90 -
 91
91 -
 92
92 -
93
-
94
-
95
-
96
-
97
-
98
-
99
-
100
-
101
-
102
-
103
-
104
-
105
-
106
-
107
-
108
-
109
-
110
-
111
-
112
-
113
-
114
-
115
-
116
-
117
-
118
-
119
-
120
-
121
-
122
-
123
-
124
-
125
-
126
-
127
-
128
-
129
-
130
-
131
-
132
-
133
-
134
-
135
-
136
-
137
-
138
-
139
-
140
-
141
-
142
-
143
-
144
-
145
-
146
-
147
-
148
-
149
-
150
-
151
-
152
-
153
-
154
-
155
-
156
-
157
-
158
-
159
-
160
-
161
-
162
-
163
-
164
-
165
-
166
-
167
-
168
-
169
-
170
-
171
-
172
-
173
-
174
-
175
-
176
-
177
-
178
-
179
-
180
-
181
-
182
-
183
-
184
-
185
-
186
-
187
-
188
-
189
-
190
-
191
-
192
-
193
-
194
-
195
-
196
-
197
-
198
-
199
-
200
-
201
-
202
-
203
-
204
-
205
-
206
-
207
-
208
-
209
-
210
-
211
-
212
-
213
-
214
-
215
-
216
-
217
-
218
-
219
-
220
-
221
-
222
-
223
-
224
-
225
-
226
-
227
-
228
-
229
-
230
-
231
-
232
-
233
-
234
-
235
-
236
-
237
-
238
-
239
-
240
-
241
-
242
-
243
-
244
-
245
-
246
-
247
-
248
-
249
-
250
-
251
-
252
-
253
-
254
-
255
-
256
-
257
-
258
-
259
-
260
-
261
-
262
-
263
-
264
-
265
-
266
-
267
-
268
-
269
-
270
-
271
-
272
-
273
-
274
-
275
-
276
-
277
-
278
-
279
-
280
-
281
-
282
-
283
-
284
-
285
-
286
-
287
-
288
-
289
-
290
-
291
-
292
-
293
-
294
-
295
-
296
-
297
-
298
-
299
-
300
-
301
-
302
-
303
-
304
-
305
-
306
-
307
-
308
-
309
-
310
-
311
-
312
-
313
-
314
-
315
-
316
-
317
-
318
-
319
-
320
-
321
-
322
-
323
-
324
-
325
-
326
-
327
-
328
-
329
-
330
-
331
-
332
-
333
-
334
-
335
-
336
-
337
-
338
-
339
-
340
-
341
-
342
-
343
-
344
-
345
-
346
-
347
-
348
-
349
-
350
-
351
-
352
-
353
-
354
-
355
-
356
-
357
-
358
-
359
-
360
-
361
-
362
-
363
-
364
-
365
-
366
 |
 |

Table of Contents
CONSOLIDATED OVERVIEW
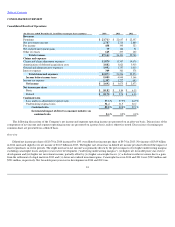
Consolidated Results of Operations
The following discussions of the Company's net income and segment operating income are presented on an after
-
tax basis. Discussions of the
components of net income and segment operating income are presented on a pretax basis, unless otherwise noted. Discussions of earnings per
common share are presented on a diluted basis.
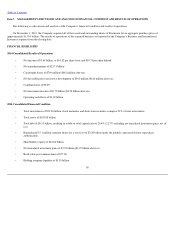
Overview
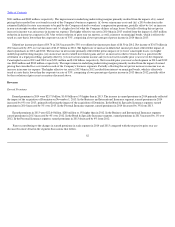
Diluted net income per share of $10.70 in 2014 increased by 10% over diluted net income per share of $9.74 in 2013. Net income of $3.69 billion
in 2014 increased slightly over net income of $3.67 billion in 2013. The higher rate of increase in diluted net income per share reflected the impact of
share repurchases in recent periods. The slight increase in net income was primarily driven by the pretax impacts of (i) higher underwriting margins
excluding catastrophe losses and prior year reserve development ("underlying underwriting margins"), (ii) higher net favorable prior year reserve
development and (iii) higher net investment income, partially offset by (iv) higher catastrophe losses, (v) a decline in other revenues due to a gain
from the settlement of a legal matter in 2013 and (vi) lower net realized investment gains. Catastrophe losses in 2014 and 2013 were $709 million and
$591 million, respectively. Net favorable prior year reserve development in 2014 and 2013 was
81
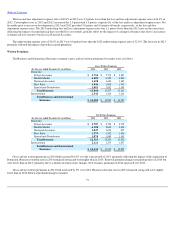
(for the year ended December 31, in millions except per share amounts)
2014
2013
2012
Revenues
Premiums
$
23,713
$
22,637
$
22,357
Net investment income
2,787
2,716
2,889
Fee income
438
395
323
Net realized investment gains
79
166
51
Other revenues
145
277
120
Total revenues
27,162
26,191
25,740
Claims and expenses
Claims and claim adjustment expenses
13,870
13,307
14,676
Amortization of deferred acquisition costs
3,882
3,821
3,910
General and administrative expenses
3,952
3,757
3,610
Interest expense
369
361
378
Total claims and expenses
22,073
21,246
22,574
Income before income taxes
5,089
4,945
3,166
Income tax expense
1,397
1,272
693
Net income
$
3,692
$
3,673
$
2,473
Net income per share
Basic
$
10.82
$
9.84
$
6.35
Diluted
$
10.70
$
9.74
$
6.30
Combined ratio
Loss and loss adjustment expense ratio
57.6
%
57.9
%
64.9
%
Underwriting expense ratio
31.4
31.9
32.2
Combined ratio
89.0
%
89.8
%
97.1
%
Incremental impact of direct to consumer initiative on
combined ratio
0.6
%
0.5
%
0.8
%