Travelers 2014 Annual Report Download - page 94
Download and view the complete annual report
Please find page 94 of the 2014 Travelers annual report below. You can navigate through the pages in the report by either clicking on the pages listed below, or by using the keyword search tool below to find specific information within the annual report.-
 1
1 -
2
-
3
-
4
-
5
-
6
-
7
-
8
-
9
-
10
-
11
-
12
-
13
-
14
-
15
-
16
-
17
-
18
-
19
-
20
-
21
-
22
-
23
-
24
-
25
-
26
-
27
-
28
-
29
-
30
-
31
-
32
-
33
-
34
-
35
-
36
-
37
-
38
-
39
-
40
-
41
-
42
-
43
-
44
-
45
-
46
-
47
-
48
-
49
-
50
-
51
-
52
-
53
-
54
-
55
-
56
-
57
-
58
-
59
-
60
-
61
-
62
-
63
-
64
-
65
-
66
-
67
-
68
-
69
-
70
-
71
-
72
-
73
-
74
-
75
-
76
-
77
-
78
-
79
-
80
-
81
-
82
-
83
-
 84
84 -
 85
85 -
 86
86 -
 87
87 -
 88
88 -
 89
89 -
 90
90 -
 91
91 -
 92
92 -
 93
93 -
 94
94 -
 95
95 -
 96
96 -
 97
97 -
 98
98 -
 99
99 -
 100
100 -
 101
101 -
 102
102 -
 103
103 -
 104
104 -
105
-
106
-
107
-
108
-
109
-
110
-
111
-
112
-
113
-
114
-
115
-
116
-
117
-
118
-
119
-
120
-
121
-
122
-
123
-
124
-
125
-
126
-
127
-
128
-
129
-
130
-
131
-
132
-
133
-
134
-
135
-
136
-
137
-
138
-
139
-
140
-
141
-
142
-
143
-
144
-
145
-
146
-
147
-
148
-
149
-
150
-
151
-
152
-
153
-
154
-
155
-
156
-
157
-
158
-
159
-
160
-
161
-
162
-
163
-
164
-
165
-
166
-
167
-
168
-
169
-
170
-
171
-
172
-
173
-
174
-
175
-
176
-
177
-
178
-
179
-
180
-
181
-
182
-
183
-
184
-
185
-
186
-
187
-
188
-
189
-
190
-
191
-
192
-
193
-
194
-
195
-
196
-
197
-
198
-
199
-
200
-
201
-
202
-
203
-
204
-
205
-
206
-
207
-
208
-
209
-
210
-
211
-
212
-
213
-
214
-
215
-
216
-
217
-
218
-
219
-
220
-
221
-
222
-
223
-
224
-
225
-
226
-
227
-
228
-
229
-
230
-
231
-
232
-
233
-
234
-
235
-
236
-
237
-
238
-
239
-
240
-
241
-
242
-
243
-
244
-
245
-
246
-
247
-
248
-
249
-
250
-
251
-
252
-
253
-
254
-
255
-
256
-
257
-
258
-
259
-
260
-
261
-
262
-
263
-
264
-
265
-
266
-
267
-
268
-
269
-
270
-
271
-
272
-
273
-
274
-
275
-
276
-
277
-
278
-
279
-
280
-
281
-
282
-
283
-
284
-
285
-
286
-
287
-
288
-
289
-
290
-
291
-
292
-
293
-
294
-
295
-
296
-
297
-
298
-
299
-
300
-
301
-
302
-
303
-
304
-
305
-
306
-
307
-
308
-
309
-
310
-
311
-
312
-
313
-
314
-
315
-
316
-
317
-
318
-
319
-
320
-
321
-
322
-
323
-
324
-
325
-
326
-
327
-
328
-
329
-
330
-
331
-
332
-
333
-
334
-
335
-
336
-
337
-
338
-
339
-
340
-
341
-
342
-
343
-
344
-
345
-
346
-
347
-
348
-
349
-
350
-
351
-
352
-
353
-
354
-
355
-
356
-
357
-
358
-
359
-
360
-
361
-
362
-
363
-
364
-
365
-
366
 |
 |

Table of Contents
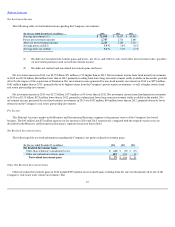
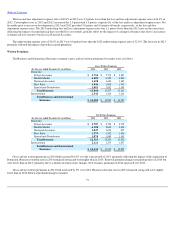
2013, reflecting the impact of the acquisition of Dominion. Net written premiums of $1.28 billion in 2013 increased by 21% over 2012. The increase in
2013 primarily reflected the impact of the acquisition of Dominion. Excluding the surety line of business, for which the following are not relevant
measures, business retention rates remained strong and were higher than in 2012. Renewal premium changes in 2013 were positive and increased
over 2012, as growth in insured exposures in 2013, compared with a decline in 2012, was partially offset by lower positive renewal rate changes in
2013 compared with 2012. New business premiums in 2013 increased over 2012.
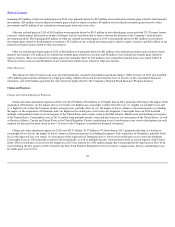
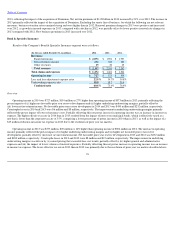
Bond & Specialty Insurance
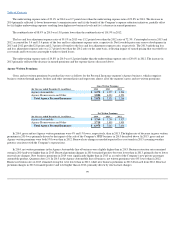
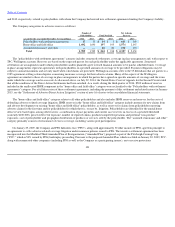
Results of the Company's Bond & Specialty Insurance segment were as follows:
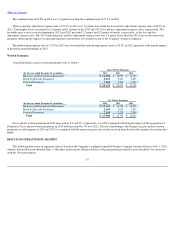
Overview
Operating income in 2014 was $727 million, $154 million or 27% higher than operating income of $573 million in 2013, primarily reflecting the
pretax impacts of (i) higher net favorable prior year reserve development and (ii) higher underlying underwriting margins, partially offset by
(iii) lower net investment income. Net favorable prior year reserve development in 2014 and 2013 was $450 million and $232 million, respectively.
Catastrophe losses in 2014 and 2013 were $6 million and $8 million, respectively. The improvement in underlying underwriting margins primarily
reflected the pretax impact of lower reinsurance costs. Partially offsetting this net pretax increase in operating income was an increase in income tax
expense. The higher effective tax rate in 2014 than in 2013 resulted from the impact of interest on municipal bonds, which is effectively taxed at a
rate that is lower than the corporate tax rate of 35%, comprising a lower percentage of pretax income in 2014 than in 2013, as well as the impact of a
$15 million reduction in income tax expense in 2013 due to the resolution of prior year tax matters.
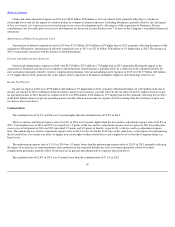
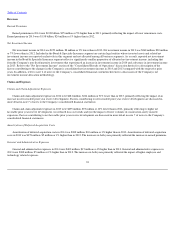
Operating income in 2013 was $573 million, $69 million or 14% higher than operating income of $504 million in 2012. The increase in operating
income primarily reflected the pretax impact of (i) higher underlying underwriting margins and (ii) higher net favorable prior year reserve
development, partially offset by (iii) lower net investment income. Net favorable prior year reserve development in 2013 and 2012 was $232 million
and $180 million, respectively. Catastrophe losses in 2013 and 2012 were $8 million and $15 million, respectively. The improvement in underlying
underwriting margins was driven by (i) earned pricing that exceeded loss cost trends, partially offset by (ii) higher general and administrative
expenses and (iii) the impact of lower volumes of insured exposures. Partially offsetting this net pretax increase in operating income was an increase
in income tax expense. The lower effective tax rate in 2013 than in 2012 was primarily due to the resolution of prior year tax matters described above.
93
(for the year ended December 31, in millions)
2014
2013
2012
Revenues:
Earned premiums
$
2,076
$
1,981
$
1,957
Net investment income
252
260
280
Other revenues
19
20
25
Total revenues
$
2,347
$
2,261
$
2,262
Total claims and expenses
$
1,272
$
1,461
$
1,544
Operating income
$
727
$
573
$
504
Loss and loss adjustment expense ratio
22.8
%
34.7
%
39.8
%
Underwriting expense ratio
38.0
38.7
38.6
Combined ratio
60.8
%
73.4
%
78.4
%