Travelers 2014 Annual Report Download - page 111
Download and view the complete annual report
Please find page 111 of the 2014 Travelers annual report below. You can navigate through the pages in the report by either clicking on the pages listed below, or by using the keyword search tool below to find specific information within the annual report.-
 1
1 -
2
-
3
-
4
-
5
-
6
-
7
-
8
-
9
-
10
-
11
-
12
-
13
-
14
-
15
-
16
-
17
-
18
-
19
-
20
-
21
-
22
-
23
-
24
-
25
-
26
-
27
-
28
-
29
-
30
-
31
-
32
-
33
-
34
-
35
-
36
-
37
-
38
-
39
-
40
-
41
-
42
-
43
-
44
-
45
-
46
-
47
-
48
-
49
-
50
-
51
-
52
-
53
-
54
-
55
-
56
-
57
-
58
-
59
-
60
-
61
-
62
-
63
-
64
-
65
-
66
-
67
-
68
-
69
-
70
-
71
-
72
-
73
-
74
-
75
-
76
-
77
-
78
-
79
-
80
-
81
-
82
-
83
-
84
-
85
-
86
-
87
-
88
-
89
-
90
-
91
-
92
-
93
-
94
-
95
-
96
-
97
-
98
-
99
-
100
-
 101
101 -
 102
102 -
 103
103 -
 104
104 -
 105
105 -
 106
106 -
 107
107 -
 108
108 -
 109
109 -
 110
110 -
 111
111 -
 112
112 -
 113
113 -
 114
114 -
 115
115 -
 116
116 -
 117
117 -
 118
118 -
 119
119 -
 120
120 -
 121
121 -
122
-
123
-
124
-
125
-
126
-
127
-
128
-
129
-
130
-
131
-
132
-
133
-
134
-
135
-
136
-
137
-
138
-
139
-
140
-
141
-
142
-
143
-
144
-
145
-
146
-
147
-
148
-
149
-
150
-
151
-
152
-
153
-
154
-
155
-
156
-
157
-
158
-
159
-
160
-
161
-
162
-
163
-
164
-
165
-
166
-
167
-
168
-
169
-
170
-
171
-
172
-
173
-
174
-
175
-
176
-
177
-
178
-
179
-
180
-
181
-
182
-
183
-
184
-
185
-
186
-
187
-
188
-
189
-
190
-
191
-
192
-
193
-
194
-
195
-
196
-
197
-
198
-
199
-
200
-
201
-
202
-
203
-
204
-
205
-
206
-
207
-
208
-
209
-
210
-
211
-
212
-
213
-
214
-
215
-
216
-
217
-
218
-
219
-
220
-
221
-
222
-
223
-
224
-
225
-
226
-
227
-
228
-
229
-
230
-
231
-
232
-
233
-
234
-
235
-
236
-
237
-
238
-
239
-
240
-
241
-
242
-
243
-
244
-
245
-
246
-
247
-
248
-
249
-
250
-
251
-
252
-
253
-
254
-
255
-
256
-
257
-
258
-
259
-
260
-
261
-
262
-
263
-
264
-
265
-
266
-
267
-
268
-
269
-
270
-
271
-
272
-
273
-
274
-
275
-
276
-
277
-
278
-
279
-
280
-
281
-
282
-
283
-
284
-
285
-
286
-
287
-
288
-
289
-
290
-
291
-
292
-
293
-
294
-
295
-
296
-
297
-
298
-
299
-
300
-
301
-
302
-
303
-
304
-
305
-
306
-
307
-
308
-
309
-
310
-
311
-
312
-
313
-
314
-
315
-
316
-
317
-
318
-
319
-
320
-
321
-
322
-
323
-
324
-
325
-
326
-
327
-
328
-
329
-
330
-
331
-
332
-
333
-
334
-
335
-
336
-
337
-
338
-
339
-
340
-
341
-
342
-
343
-
344
-
345
-
346
-
347
-
348
-
349
-
350
-
351
-
352
-
353
-
354
-
355
-
356
-
357
-
358
-
359
-
360
-
361
-
362
-
363
-
364
-
365
-
366
 |
 |

Table of Contents
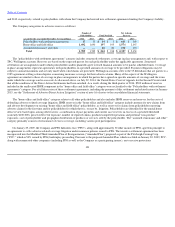
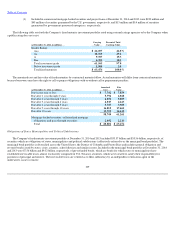
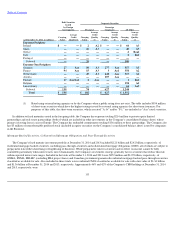
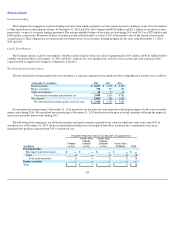
The following table shows the geographic distribution of the $26.01 billion of municipal bonds at December 31, 2014 that were not pre
-
refunded.
110
(at December 31, 2014, in millions)
State
General
Obligation
Local
General
Obligation
Revenue
Total
Carrying
Value
Average
Credit
Quality(1)
State:
Texas
$
210
$
2,472
$
1,166
$
3,848
Aaa/Aa1
Washington
168
920
620
1,708
Aa1
Virginia
126
670
895
1,691
Aaa/Aa1
California
43
1,142
453
1,638
Aa1
Minnesota
171
850
130
1,151
Aaa/Aa1
Illinois
147
668
279
1,094
Aa2
North Carolina
81
731
272
1,084
Aaa
Massachusetts
90
30
956
1,076
Aaa/Aa1
Maryland
162
512
220
894
Aaa/Aa1
Florida
172
51
570
793
Aa1
Arizona
—
417
374
791
Aa1
Colorado
—
521
243
764
Aa1
Georgia
112
314
317
743
Aaa/Aa1
All others(2)(3)
1,121
3,707
3,909
8,737
Aa1
Total
$
2,603
$
13,005
$
10,404
$
26,012
Aaa/Aa1
(1)
Rated using external rating agencies or by the Company when a public rating does not exist. Ratings shown are the higher of
the rating of the underlying issuer or the insurer in the case of securities enhanced by third
-
party insurance for the payment
of principal and interest in the event of issuer default.
(2)
No other single state accounted for 2.5% or more of the total non
-
pre
-
refunded municipal bonds.
(3)
The Company owns $1 million of non
-
pre
-
refunded bonds issued by Puerto Rico, which have an average credit quality rating
of "B2." The Company does not own any municipal securities issued by the city of Detroit, MI.