Travelers 2014 Annual Report Download - page 280
Download and view the complete annual report
Please find page 280 of the 2014 Travelers annual report below. You can navigate through the pages in the report by either clicking on the pages listed below, or by using the keyword search tool below to find specific information within the annual report.-
 1
1 -
2
-
3
-
4
-
5
-
6
-
7
-
8
-
9
-
10
-
11
-
12
-
13
-
14
-
15
-
16
-
17
-
18
-
19
-
20
-
21
-
22
-
23
-
24
-
25
-
26
-
27
-
28
-
29
-
30
-
31
-
32
-
33
-
34
-
35
-
36
-
37
-
38
-
39
-
40
-
41
-
42
-
43
-
44
-
45
-
46
-
47
-
48
-
49
-
50
-
51
-
52
-
53
-
54
-
55
-
56
-
57
-
58
-
59
-
60
-
61
-
62
-
63
-
64
-
65
-
66
-
67
-
68
-
69
-
70
-
71
-
72
-
73
-
74
-
75
-
76
-
77
-
78
-
79
-
80
-
81
-
82
-
83
-
84
-
85
-
86
-
87
-
88
-
89
-
90
-
91
-
92
-
93
-
94
-
95
-
96
-
97
-
98
-
99
-
100
-
101
-
102
-
103
-
104
-
105
-
106
-
107
-
108
-
109
-
110
-
111
-
112
-
113
-
114
-
115
-
116
-
117
-
118
-
119
-
120
-
121
-
122
-
123
-
124
-
125
-
126
-
127
-
128
-
129
-
130
-
131
-
132
-
133
-
134
-
135
-
136
-
137
-
138
-
139
-
140
-
141
-
142
-
143
-
144
-
145
-
146
-
147
-
148
-
149
-
150
-
151
-
152
-
153
-
154
-
155
-
156
-
157
-
158
-
159
-
160
-
161
-
162
-
163
-
164
-
165
-
166
-
167
-
168
-
169
-
170
-
171
-
172
-
173
-
174
-
175
-
176
-
177
-
178
-
179
-
180
-
181
-
182
-
183
-
184
-
185
-
186
-
187
-
188
-
189
-
190
-
191
-
192
-
193
-
194
-
195
-
196
-
197
-
198
-
199
-
200
-
201
-
202
-
203
-
204
-
205
-
206
-
207
-
208
-
209
-
210
-
211
-
212
-
213
-
214
-
215
-
216
-
217
-
218
-
219
-
220
-
221
-
222
-
223
-
224
-
225
-
226
-
227
-
228
-
229
-
230
-
231
-
232
-
233
-
234
-
235
-
236
-
237
-
238
-
239
-
240
-
241
-
242
-
243
-
244
-
245
-
246
-
247
-
248
-
249
-
250
-
251
-
252
-
253
-
254
-
255
-
256
-
257
-
258
-
259
-
260
-
261
-
262
-
263
-
264
-
265
-
266
-
267
-
268
-
269
-
 270
270 -
 271
271 -
 272
272 -
 273
273 -
 274
274 -
 275
275 -
 276
276 -
 277
277 -
 278
278 -
 279
279 -
 280
280 -
 281
281 -
 282
282 -
 283
283 -
 284
284 -
 285
285 -
 286
286 -
 287
287 -
 288
288 -
 289
289 -
 290
290 -
291
-
292
-
293
-
294
-
295
-
296
-
297
-
298
-
299
-
300
-
301
-
302
-
303
-
304
-
305
-
306
-
307
-
308
-
309
-
310
-
311
-
312
-
313
-
314
-
315
-
316
-
317
-
318
-
319
-
320
-
321
-
322
-
323
-
324
-
325
-
326
-
327
-
328
-
329
-
330
-
331
-
332
-
333
-
334
-
335
-
336
-
337
-
338
-
339
-
340
-
341
-
342
-
343
-
344
-
345
-
346
-
347
-
348
-
349
-
350
-
351
-
352
-
353
-
354
-
355
-
356
-
357
-
358
-
359
-
360
-
361
-
362
-
363
-
364
-
365
-
366
 |
 |

Table of Contents
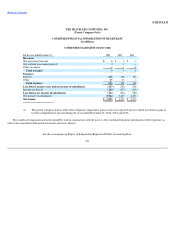
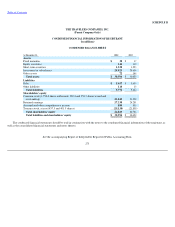
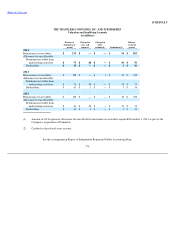
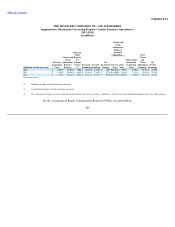
SCHEDULE II
THE TRAVELERS COMPANIES, INC.
(Parent Company Only)
CONDENSED FINANCIAL INFORMATION OF REGISTRANT
(in millions)
CONDENSED STATEMENT OF CASH FLOWS
The condensed financial statements should be read in conjunction with the notes to the condensed financial information of the registrant, as
well as the consolidated financial statements and notes thereto.
See the accompanying Report of Independent Registered Public Accounting Firm.
276
For the year ended December 31,
2014
2013
2012
Cash flows from operating activities
Net income
$
3,692
$
3,673
$
2,473
Adjustments to reconcile net income to net cash provided by
operating activities:
Equity in net income of subsidiaries
(3,904
)
(3,815
)
(2,655
)
Dividends received from consolidated subsidiaries
4,071
2,423
1,920
Deferred federal income tax expense (benefit)
51
(59
)
52
Change in income taxes payable
(87
)
48
(1
)
Capital contributed to subsidiaries
—
(
500
)
—
Other
(13
)
238
(16
)
Net cash provided by operating activities
3,810
2,008
1,773
Cash flows from investing activities
Net sales (purchases) of short
-
term securities
(7
)
435
381
Other investments, net
5
(3
)
(8
)
Net cash provided by (used in) investing activities
(2
)
432
373
Cash flows from financing activities
Treasury stock acquired—share repurchase authorization
(3,275
)
(2,400
)
(1,474
)
Treasury stock acquired—net employee share
-
based compensation
(57
)
(61
)
(53
)
Dividends paid to shareholders
(729
)
(729
)
(694
)
Issuance of common stock—employee share options
195
206
295
Payment of debt
—
—
(
258
)
Issuance of debt
—
494
—
Other
57
51
38
Net cash used in financing activities
(3,809
)
(2,439
)
(2,146
)
Net increase (decrease) in cash
(1
)
1
—
Cash at beginning of year
3
2
2
Cash at end of year
$
2
$
3
$
2
Supplemental disclosure of cash flow information
Cash received during the year for taxes
$
136
$
210
$
207
Cash paid during the year for interest
$
318
$
295
$
302