Travelers 2014 Annual Report Download - page 100
Download and view the complete annual report
Please find page 100 of the 2014 Travelers annual report below. You can navigate through the pages in the report by either clicking on the pages listed below, or by using the keyword search tool below to find specific information within the annual report.-
 1
1 -
2
-
3
-
4
-
5
-
6
-
7
-
8
-
9
-
10
-
11
-
12
-
13
-
14
-
15
-
16
-
17
-
18
-
19
-
20
-
21
-
22
-
23
-
24
-
25
-
26
-
27
-
28
-
29
-
30
-
31
-
32
-
33
-
34
-
35
-
36
-
37
-
38
-
39
-
40
-
41
-
42
-
43
-
44
-
45
-
46
-
47
-
48
-
49
-
50
-
51
-
52
-
53
-
54
-
55
-
56
-
57
-
58
-
59
-
60
-
61
-
62
-
63
-
64
-
65
-
66
-
67
-
68
-
69
-
70
-
71
-
72
-
73
-
74
-
75
-
76
-
77
-
78
-
79
-
80
-
81
-
82
-
83
-
84
-
85
-
86
-
87
-
88
-
89
-
 90
90 -
 91
91 -
 92
92 -
 93
93 -
 94
94 -
 95
95 -
 96
96 -
 97
97 -
 98
98 -
 99
99 -
 100
100 -
 101
101 -
 102
102 -
 103
103 -
 104
104 -
 105
105 -
 106
106 -
 107
107 -
 108
108 -
 109
109 -
 110
110 -
111
-
112
-
113
-
114
-
115
-
116
-
117
-
118
-
119
-
120
-
121
-
122
-
123
-
124
-
125
-
126
-
127
-
128
-
129
-
130
-
131
-
132
-
133
-
134
-
135
-
136
-
137
-
138
-
139
-
140
-
141
-
142
-
143
-
144
-
145
-
146
-
147
-
148
-
149
-
150
-
151
-
152
-
153
-
154
-
155
-
156
-
157
-
158
-
159
-
160
-
161
-
162
-
163
-
164
-
165
-
166
-
167
-
168
-
169
-
170
-
171
-
172
-
173
-
174
-
175
-
176
-
177
-
178
-
179
-
180
-
181
-
182
-
183
-
184
-
185
-
186
-
187
-
188
-
189
-
190
-
191
-
192
-
193
-
194
-
195
-
196
-
197
-
198
-
199
-
200
-
201
-
202
-
203
-
204
-
205
-
206
-
207
-
208
-
209
-
210
-
211
-
212
-
213
-
214
-
215
-
216
-
217
-
218
-
219
-
220
-
221
-
222
-
223
-
224
-
225
-
226
-
227
-
228
-
229
-
230
-
231
-
232
-
233
-
234
-
235
-
236
-
237
-
238
-
239
-
240
-
241
-
242
-
243
-
244
-
245
-
246
-
247
-
248
-
249
-
250
-
251
-
252
-
253
-
254
-
255
-
256
-
257
-
258
-
259
-
260
-
261
-
262
-
263
-
264
-
265
-
266
-
267
-
268
-
269
-
270
-
271
-
272
-
273
-
274
-
275
-
276
-
277
-
278
-
279
-
280
-
281
-
282
-
283
-
284
-
285
-
286
-
287
-
288
-
289
-
290
-
291
-
292
-
293
-
294
-
295
-
296
-
297
-
298
-
299
-
300
-
301
-
302
-
303
-
304
-
305
-
306
-
307
-
308
-
309
-
310
-
311
-
312
-
313
-
314
-
315
-
316
-
317
-
318
-
319
-
320
-
321
-
322
-
323
-
324
-
325
-
326
-
327
-
328
-
329
-
330
-
331
-
332
-
333
-
334
-
335
-
336
-
337
-
338
-
339
-
340
-
341
-
342
-
343
-
344
-
345
-
346
-
347
-
348
-
349
-
350
-
351
-
352
-
353
-
354
-
355
-
356
-
357
-
358
-
359
-
360
-
361
-
362
-
363
-
364
-
365
-
366
 |
 |

Table of Contents
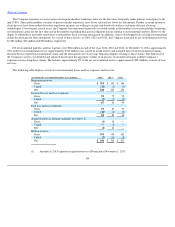
The underwriting expense ratio of 29.1% in 2014 was 0.7 points lower than the underwriting expense ratio of 29.8% in 2013. The decrease in
2014 primarily reflected (i) lower homeowners' commission rates and (ii) the benefit of the Company's expense reduction initiatives, partially offset
by (iii) higher underwriting expenses resulting from higher new business levels and (iv) a decrease in earned premiums.
The combined ratio of 88.9% in 2013 was 13.0 points lower than the combined ratio of 101.9% in 2012.
The loss and loss adjustment expense ratio of 59.1% in 2013 was 13.2 points lower than the 2012 ratio of 72.3%. Catastrophe losses in 2013 and
2012 accounted for 3.4 and 13.4 points of the loss and loss adjustment expense ratio, respectively. Net favorable prior year reserve development in
2013 and 2012 provided 2.8 points and 2.3 points of benefit to the loss and loss adjustment expense ratio, respectively. The 2013 underlying loss
and loss adjustment expense ratio was 2.7 points lower than the 2012 ratio on the same basis, reflecting impact of earned pricing that exceeded loss
cost trends and lower non
-
catastrophe weather
-
related losses.
The underwriting expense ratio of 29.8% in 2013 was 0.2 points higher than the underwriting expense ratio of 29.6% in 2012. The increase in
2013 primarily reflected the decrease in earned premiums and the expense factors discussed above.
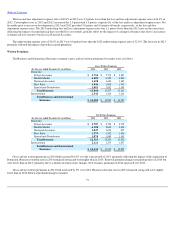
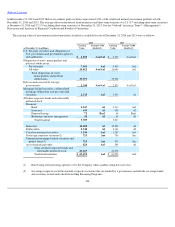
Agency Written Premiums
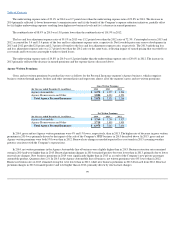
Gross and net written premiums by product line were as follows for the Personal Insurance segment's Agency business, which comprises
business written through agents, brokers and other intermediaries and represents almost all of the segment's gross and net written premiums:
In 2014, gross and net Agency written premiums were 4% and 1% lower, respectively, than in 2013. The higher rate of decrease in gross written
premiums in 2014 was primarily driven by the impact of the sale of the Company's NFIP business in 2013 described above. In 2013, gross and net
Agency written premiums were both 5% lower than in 2012. Renewal rate changes exceeded expected loss cost trends in 2013 assuming weather
patterns consistent with the Company's expectations.
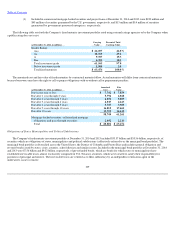
In 2014, net written premiums in the Agency Automobile line of business were slightly higher than in 2013. Business retention rates remained
strong in 2014 and were higher than in 2013. Renewal premium changes in 2014 remained positive but were lower than in 2013, primarily due to lower
renewal rate changes. New business premiums in 2014 were significantly higher than in 2013 as a result of the Company's new private passenger
automobile product, Quantum Auto 2.0. In 2013 in the Agency Automobile line of business, net written premiums were 8% lower than in 2012.
Business retention rates in 2013 remained strong but were lower than in 2012, while new business premiums in 2013 decreased from 2012. Renewal
premium changes in 2013 remained positive and were higher than in 2012, primarily driven by renewal rate changes.
99
Gross Written Premiums
(for the year ended December 31, in millions)
2014
2013
2012
Agency Automobile
$
3,278
$
3,277
$
3,544
Agency Homeowners and Other
3,800
4,094
4,220
Total Agency Personal Insurance
$
7,078
$
7,371
$
7,764
Net Written Premiums
(for the year ended December 31, in millions)
2014
2013
2012
Agency Automobile
$
3,260
$
3,258
$
3,527
Agency Homeowners and Other
3,718
3,805
3,909
Total Agency Personal Insurance
$
6,978
$
7,063
$
7,436