Travelers 2014 Annual Report Download - page 198
Download and view the complete annual report
Please find page 198 of the 2014 Travelers annual report below. You can navigate through the pages in the report by either clicking on the pages listed below, or by using the keyword search tool below to find specific information within the annual report.-
 1
1 -
2
-
3
-
4
-
5
-
6
-
7
-
8
-
9
-
10
-
11
-
12
-
13
-
14
-
15
-
16
-
17
-
18
-
19
-
20
-
21
-
22
-
23
-
24
-
25
-
26
-
27
-
28
-
29
-
30
-
31
-
32
-
33
-
34
-
35
-
36
-
37
-
38
-
39
-
40
-
41
-
42
-
43
-
44
-
45
-
46
-
47
-
48
-
49
-
50
-
51
-
52
-
53
-
54
-
55
-
56
-
57
-
58
-
59
-
60
-
61
-
62
-
63
-
64
-
65
-
66
-
67
-
68
-
69
-
70
-
71
-
72
-
73
-
74
-
75
-
76
-
77
-
78
-
79
-
80
-
81
-
82
-
83
-
84
-
85
-
86
-
87
-
88
-
89
-
90
-
91
-
92
-
93
-
94
-
95
-
96
-
97
-
98
-
99
-
100
-
101
-
102
-
103
-
104
-
105
-
106
-
107
-
108
-
109
-
110
-
111
-
112
-
113
-
114
-
115
-
116
-
117
-
118
-
119
-
120
-
121
-
122
-
123
-
124
-
125
-
126
-
127
-
128
-
129
-
130
-
131
-
132
-
133
-
134
-
135
-
136
-
137
-
138
-
139
-
140
-
141
-
142
-
143
-
144
-
145
-
146
-
147
-
148
-
149
-
150
-
151
-
152
-
153
-
154
-
155
-
156
-
157
-
158
-
159
-
160
-
161
-
162
-
163
-
164
-
165
-
166
-
167
-
168
-
169
-
170
-
171
-
172
-
173
-
174
-
175
-
176
-
177
-
178
-
179
-
180
-
181
-
182
-
183
-
184
-
185
-
186
-
187
-
 188
188 -
 189
189 -
 190
190 -
 191
191 -
 192
192 -
 193
193 -
 194
194 -
 195
195 -
 196
196 -
 197
197 -
 198
198 -
 199
199 -
 200
200 -
 201
201 -
 202
202 -
 203
203 -
 204
204 -
 205
205 -
 206
206 -
 207
207 -
 208
208 -
209
-
210
-
211
-
212
-
213
-
214
-
215
-
216
-
217
-
218
-
219
-
220
-
221
-
222
-
223
-
224
-
225
-
226
-
227
-
228
-
229
-
230
-
231
-
232
-
233
-
234
-
235
-
236
-
237
-
238
-
239
-
240
-
241
-
242
-
243
-
244
-
245
-
246
-
247
-
248
-
249
-
250
-
251
-
252
-
253
-
254
-
255
-
256
-
257
-
258
-
259
-
260
-
261
-
262
-
263
-
264
-
265
-
266
-
267
-
268
-
269
-
270
-
271
-
272
-
273
-
274
-
275
-
276
-
277
-
278
-
279
-
280
-
281
-
282
-
283
-
284
-
285
-
286
-
287
-
288
-
289
-
290
-
291
-
292
-
293
-
294
-
295
-
296
-
297
-
298
-
299
-
300
-
301
-
302
-
303
-
304
-
305
-
306
-
307
-
308
-
309
-
310
-
311
-
312
-
313
-
314
-
315
-
316
-
317
-
318
-
319
-
320
-
321
-
322
-
323
-
324
-
325
-
326
-
327
-
328
-
329
-
330
-
331
-
332
-
333
-
334
-
335
-
336
-
337
-
338
-
339
-
340
-
341
-
342
-
343
-
344
-
345
-
346
-
347
-
348
-
349
-
350
-
351
-
352
-
353
-
354
-
355
-
356
-
357
-
358
-
359
-
360
-
361
-
362
-
363
-
364
-
365
-
366
 |
 |

Table of Contents
THE TRAVELERS COMPANIES, INC. AND SUBSIDIARIES
NOTES TO CONSOLIDATED FINANCIAL STATEMENTS (Continued)
3. INVESTMENTS (Continued)
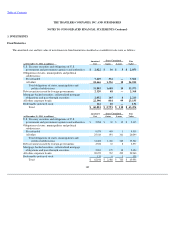
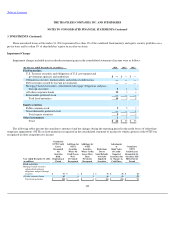
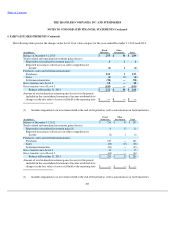
Changes in net unrealized gains on investment securities that are included as a separate component of other comprehensive income (loss)
were as follows:
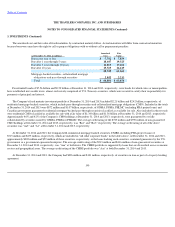
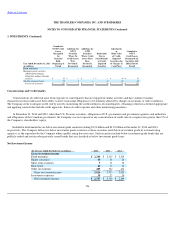
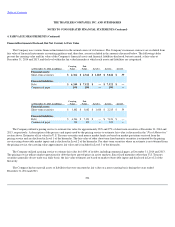
Derivative Financial Instruments
From time to time, the Company enters into U.S. Treasury note futures contracts to modify the effective duration of specific assets within the
investment portfolio. U.S. Treasury futures contracts require a daily mark
-
to
-
market and settlement with the broker. At December 31, 2014 and 2013,
the Company had $350 million and $0 notional value of open U.S. Treasury futures contracts, respectively. Net realized investment gains in 2014,
2013 and 2012 included net losses of $1 million, net gains of $115 million and net losses of $14 million, respectively, related to U.S. Treasury futures
contracts.
The Company purchases investments that have embedded derivatives, primarily convertible debt securities. These embedded derivatives are
carried at fair value with changes in value reflected in net realized investment gains. Derivatives embedded in convertible debt securities are
reported on a combined basis with their host instrument and are classified as fixed maturity securities. The Company recorded net realized losses of
less than $1 million in 2014, net realized investment gains of less than $1 million in 2013 and net realized investment losses of less than $1 million in
2012 related to these embedded derivatives.
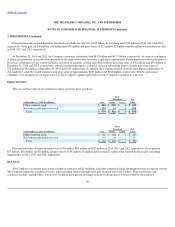
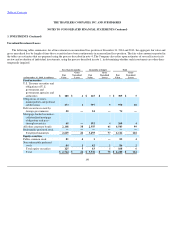
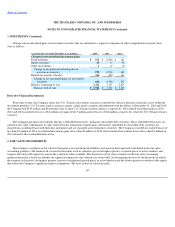
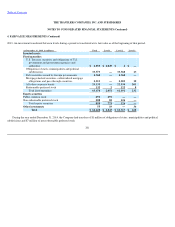
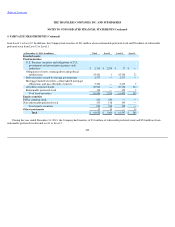
4. FAIR VALUE MEASUREMENTS
The Company's estimates of fair value for financial assets and financial liabilities are based on the framework established in the fair value
accounting guidance. The framework is based on the inputs used in valuation, gives the highest priority to quoted prices in active markets and
requires that observable inputs be used in the valuations when available. The disclosure of fair value estimates in the fair value accounting
guidance hierarchy is based on whether the significant inputs into the valuation are observable. In determining the level of the hierarchy in which
the estimate is disclosed, the highest priority is given to unadjusted quoted prices in active markets and the lowest priority to unobservable inputs
that reflect the Company's significant market assumptions. The level in the fair value hierarchy
197
(at and for the year ended December 31, in millions)
2014
2013
2012
Changes in net unrealized investment gains
Fixed maturities
$
913
$
(2,804
)
$
326
Equity securities
63
74
38
Other investments
2
(1
)
(2
)
Change in net pretax unrealized gains on
investment securities
978
(2,731
)
362
Related tax expense (benefit)
334
(950
)
130
Change in net unrealized gains on investment
securities
644
(1,781
)
232
Balance, beginning of year
1,322
3,103
2,871
Balance, end of year
$
1,966
$
1,322
$
3,103