Travelers 2014 Annual Report Download - page 234
Download and view the complete annual report
Please find page 234 of the 2014 Travelers annual report below. You can navigate through the pages in the report by either clicking on the pages listed below, or by using the keyword search tool below to find specific information within the annual report.-
 1
1 -
2
-
3
-
4
-
5
-
6
-
7
-
8
-
9
-
10
-
11
-
12
-
13
-
14
-
15
-
16
-
17
-
18
-
19
-
20
-
21
-
22
-
23
-
24
-
25
-
26
-
27
-
28
-
29
-
30
-
31
-
32
-
33
-
34
-
35
-
36
-
37
-
38
-
39
-
40
-
41
-
42
-
43
-
44
-
45
-
46
-
47
-
48
-
49
-
50
-
51
-
52
-
53
-
54
-
55
-
56
-
57
-
58
-
59
-
60
-
61
-
62
-
63
-
64
-
65
-
66
-
67
-
68
-
69
-
70
-
71
-
72
-
73
-
74
-
75
-
76
-
77
-
78
-
79
-
80
-
81
-
82
-
83
-
84
-
85
-
86
-
87
-
88
-
89
-
90
-
91
-
92
-
93
-
94
-
95
-
96
-
97
-
98
-
99
-
100
-
101
-
102
-
103
-
104
-
105
-
106
-
107
-
108
-
109
-
110
-
111
-
112
-
113
-
114
-
115
-
116
-
117
-
118
-
119
-
120
-
121
-
122
-
123
-
124
-
125
-
126
-
127
-
128
-
129
-
130
-
131
-
132
-
133
-
134
-
135
-
136
-
137
-
138
-
139
-
140
-
141
-
142
-
143
-
144
-
145
-
146
-
147
-
148
-
149
-
150
-
151
-
152
-
153
-
154
-
155
-
156
-
157
-
158
-
159
-
160
-
161
-
162
-
163
-
164
-
165
-
166
-
167
-
168
-
169
-
170
-
171
-
172
-
173
-
174
-
175
-
176
-
177
-
178
-
179
-
180
-
181
-
182
-
183
-
184
-
185
-
186
-
187
-
188
-
189
-
190
-
191
-
192
-
193
-
194
-
195
-
196
-
197
-
198
-
199
-
200
-
201
-
202
-
203
-
204
-
205
-
206
-
207
-
208
-
209
-
210
-
211
-
212
-
213
-
214
-
215
-
216
-
217
-
218
-
219
-
220
-
221
-
222
-
223
-
 224
224 -
 225
225 -
 226
226 -
 227
227 -
 228
228 -
 229
229 -
 230
230 -
 231
231 -
 232
232 -
 233
233 -
 234
234 -
 235
235 -
 236
236 -
 237
237 -
 238
238 -
 239
239 -
 240
240 -
 241
241 -
 242
242 -
 243
243 -
 244
244 -
245
-
246
-
247
-
248
-
249
-
250
-
251
-
252
-
253
-
254
-
255
-
256
-
257
-
258
-
259
-
260
-
261
-
262
-
263
-
264
-
265
-
266
-
267
-
268
-
269
-
270
-
271
-
272
-
273
-
274
-
275
-
276
-
277
-
278
-
279
-
280
-
281
-
282
-
283
-
284
-
285
-
286
-
287
-
288
-
289
-
290
-
291
-
292
-
293
-
294
-
295
-
296
-
297
-
298
-
299
-
300
-
301
-
302
-
303
-
304
-
305
-
306
-
307
-
308
-
309
-
310
-
311
-
312
-
313
-
314
-
315
-
316
-
317
-
318
-
319
-
320
-
321
-
322
-
323
-
324
-
325
-
326
-
327
-
328
-
329
-
330
-
331
-
332
-
333
-
334
-
335
-
336
-
337
-
338
-
339
-
340
-
341
-
342
-
343
-
344
-
345
-
346
-
347
-
348
-
349
-
350
-
351
-
352
-
353
-
354
-
355
-
356
-
357
-
358
-
359
-
360
-
361
-
362
-
363
-
364
-
365
-
366
 |
 |

Table of Contents
THE TRAVELERS COMPANIES, INC. AND SUBSIDIARIES
NOTES TO CONSOLIDATED FINANCIAL STATEMENTS (Continued)
13. SHARE
-
BASED INCENTIVE COMPENSATION (Continued)
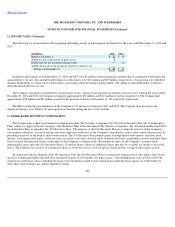
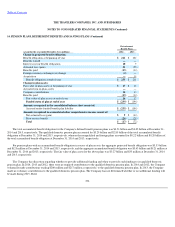
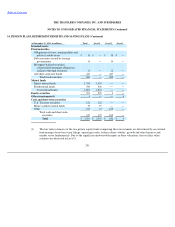
The Company also has a Performance Share Awards Program established pursuant to the 2004 Incentive Plan and which continues pursuant to
the 2014 Incentive Plan. Under the program, the Company may issue performance share awards to certain employees of the Company who hold
positions of Vice President (or its equivalent) or above. The performance awards provide the recipient the right to earn shares of the Company's
common stock based upon the Company's attainment of certain performance goals and the recipient meeting certain years of service criteria. The
performance goals for performance awards are based on the Company's adjusted return on equity over a three
-
year performance period. Vesting of
performance shares is contingent upon the Company attaining the relevant performance period minimum threshold return on equity and the
recipient meeting certain years of service criteria, generally three years for full vesting, subject to proration for certain termination conditions. If the
performance period return on equity is below the minimum threshold, none of the shares will vest. If performance meets or exceeds the minimum
performance threshold, a range of performance shares will vest (50%—130% for awards granted in February 2012 and 2013; and 50%—
150% for
awards granted in 2014 and 2015), depending on the actual return on equity attained.
The fair value of restricted stock units, deferred stock units and performance shares is measured at the market price of the Company stock at
date of grant. Under terms of the 2014 Incentive Plan, holders of deferred stock units and performance shares may receive dividend equivalents.
The total fair value of shares that vested during the years ended December 31, 2014, 2013 and 2012 was $147 million, $151 million and
$146 million, respectively.
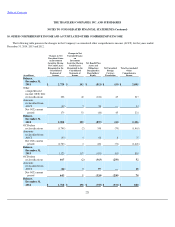
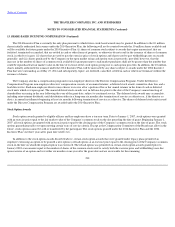
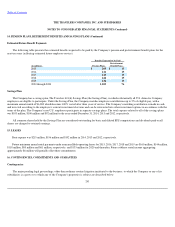
A summary of restricted stock units, deferred stock units and performance share activity under the Company's 2014 Incentive Plan and legacy
plans as of and for the year ended December 31, 2014 is as follows:
In addition to the nonvested shares presented in the above table, there are related nonvested dividend equivalent shares. The number of
nonvested dividend equivalent shares related to deferred stock units was 372 at the beginning of the year and 387 at the end of the year and the
number of nonvested dividend equivalent shares related to performance shares was 14,584 at the beginning of the year and 38,738 at the end of the
year. The dividend equivalent shares are subject to the same vesting terms as the deferred stock units and performance shares.
233
Restricted and Deferred Stock
Units
Performance Shares
Other Equity Instruments
Number
Weighted Average
Grant
-
Date
Fair Value
Number
Weighted Average
Grant
-
Date
Fair Value
Nonvested, beginning of year
1,952,274
$
64.60
1,389,770
$
68.38
Granted
759,151
80.63
594,901
80.35
Vested
(885,048
)
(1)
61.76
(801,479
)
(2)
59.74
Forfeited
(65,406
)
78.88
(99,547
)
71.50
Performance
-
based adjustment
—
—
206,424
(3)
71.12
Nonvested, end of year
1,760,971
$
72.40
1,290,069
$
79.46
(1)
Represents awards for which the requisite service has been rendered.
(2)
Reflects the number of performance shares attributable to the performance goals attained over the completed performance
period (three years) and for which service conditions have been met.
(3)
Represents the current year change in estimated performance shares to reflect the attainment of performance goals for the
awards that were granted in each of the years 2012 through 2014.