Travelers 2014 Annual Report Download - page 96
Download and view the complete annual report
Please find page 96 of the 2014 Travelers annual report below. You can navigate through the pages in the report by either clicking on the pages listed below, or by using the keyword search tool below to find specific information within the annual report.-
 1
1 -
2
-
3
-
4
-
5
-
6
-
7
-
8
-
9
-
10
-
11
-
12
-
13
-
14
-
15
-
16
-
17
-
18
-
19
-
20
-
21
-
22
-
23
-
24
-
25
-
26
-
27
-
28
-
29
-
30
-
31
-
32
-
33
-
34
-
35
-
36
-
37
-
38
-
39
-
40
-
41
-
42
-
43
-
44
-
45
-
46
-
47
-
48
-
49
-
50
-
51
-
52
-
53
-
54
-
55
-
56
-
57
-
58
-
59
-
60
-
61
-
62
-
63
-
64
-
65
-
66
-
67
-
68
-
69
-
70
-
71
-
72
-
73
-
74
-
75
-
76
-
77
-
78
-
79
-
80
-
81
-
82
-
83
-
84
-
85
-
 86
86 -
 87
87 -
 88
88 -
 89
89 -
 90
90 -
 91
91 -
 92
92 -
 93
93 -
 94
94 -
 95
95 -
 96
96 -
 97
97 -
 98
98 -
 99
99 -
 100
100 -
 101
101 -
 102
102 -
 103
103 -
 104
104 -
 105
105 -
 106
106 -
107
-
108
-
109
-
110
-
111
-
112
-
113
-
114
-
115
-
116
-
117
-
118
-
119
-
120
-
121
-
122
-
123
-
124
-
125
-
126
-
127
-
128
-
129
-
130
-
131
-
132
-
133
-
134
-
135
-
136
-
137
-
138
-
139
-
140
-
141
-
142
-
143
-
144
-
145
-
146
-
147
-
148
-
149
-
150
-
151
-
152
-
153
-
154
-
155
-
156
-
157
-
158
-
159
-
160
-
161
-
162
-
163
-
164
-
165
-
166
-
167
-
168
-
169
-
170
-
171
-
172
-
173
-
174
-
175
-
176
-
177
-
178
-
179
-
180
-
181
-
182
-
183
-
184
-
185
-
186
-
187
-
188
-
189
-
190
-
191
-
192
-
193
-
194
-
195
-
196
-
197
-
198
-
199
-
200
-
201
-
202
-
203
-
204
-
205
-
206
-
207
-
208
-
209
-
210
-
211
-
212
-
213
-
214
-
215
-
216
-
217
-
218
-
219
-
220
-
221
-
222
-
223
-
224
-
225
-
226
-
227
-
228
-
229
-
230
-
231
-
232
-
233
-
234
-
235
-
236
-
237
-
238
-
239
-
240
-
241
-
242
-
243
-
244
-
245
-
246
-
247
-
248
-
249
-
250
-
251
-
252
-
253
-
254
-
255
-
256
-
257
-
258
-
259
-
260
-
261
-
262
-
263
-
264
-
265
-
266
-
267
-
268
-
269
-
270
-
271
-
272
-
273
-
274
-
275
-
276
-
277
-
278
-
279
-
280
-
281
-
282
-
283
-
284
-
285
-
286
-
287
-
288
-
289
-
290
-
291
-
292
-
293
-
294
-
295
-
296
-
297
-
298
-
299
-
300
-
301
-
302
-
303
-
304
-
305
-
306
-
307
-
308
-
309
-
310
-
311
-
312
-
313
-
314
-
315
-
316
-
317
-
318
-
319
-
320
-
321
-
322
-
323
-
324
-
325
-
326
-
327
-
328
-
329
-
330
-
331
-
332
-
333
-
334
-
335
-
336
-
337
-
338
-
339
-
340
-
341
-
342
-
343
-
344
-
345
-
346
-
347
-
348
-
349
-
350
-
351
-
352
-
353
-
354
-
355
-
356
-
357
-
358
-
359
-
360
-
361
-
362
-
363
-
364
-
365
-
366
 |
 |

Table of Contents
Income Tax Expense
Income tax expense in 2014 was $348 million, $121 million or 53% higher than in 2013, primarily reflecting the tax effect of the $275 million
increase in pre
-
tax operating income, as well as the impact of a $15 million reduction in income tax expenses in 2013 resulting from the resolution of
prior year tax matters. Income tax expense in 2013 was $227 million, $13 million or 6% higher than in 2012, primarily reflecting the tax effect of the
$82 million increase in pre
-
tax operating income, partially offset by the impact of the $15 million reduction in income tax expense in 2013 resulting
from the resolution of prior year tax matters.
Combined Ratio
The combined ratio of 60.8% in 2014 was 12.6 points lower than the combined ratio of 73.4% in 2013.
The loss and loss adjustment expense ratio of 22.8% in 2014 was 11.9 points lower than the loss and loss adjustment expense ratio of 34.7% in
2013. Net favorable prior year reserve development in 2014 and 2013 provided 21.7 points and 11.7 points of benefit, respectively, to the loss and
loss adjustment expense ratio. Catastrophe losses in 2014 and 2013 accounted for 0.3 points and 0.4 points, respectively, of the loss and loss
adjustment expense ratio. The underlying loss and loss adjustment expense ratio in 2014 was 1.8 points lower than the 2013 ratio on the same basis,
primarily reflecting the impact of lower reinsurance costs.
The underwriting expense ratio of 38.0% in 2014 was 0.7 points lower than the underwriting expense ratio of 38.7% in 2013. The improvement in
2014 primarily reflected the impact of increases in earned premiums largely due to lower reinsurance costs.
The combined ratio of 73.4% in 2013 was 5.0 points lower than the combined ratio of 78.4% in 2012.
The loss and loss adjustment expense ratio of 34.7% in 2013 was 5.1 points lower than the 2012 ratio of 39.8%. Net favorable prior year reserve
development provided 11.7 points and 9.2 points of benefit, respectively, to the loss and loss adjustment expense ratio in 2013 and 2012.
Catastrophe losses in 2013 and 2012 accounted for 0.4 points and 0.7 points of the loss and loss adjustment expense ratio, respectively. The 2013
underlying loss and loss adjustment expense ratio was 2.3 points lower than the 2012 ratio on the same basis, reflecting the impact of earned pricing
that exceeded loss cost trends.
The underwriting expense ratio of 38.7% in 2013 was 0.1 points higher than the underwriting expense ratio of 38.6% in 2012.
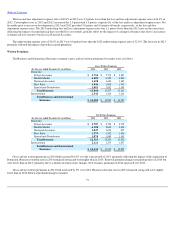
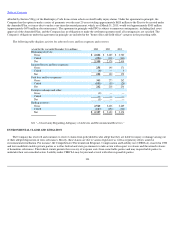
Written Premiums
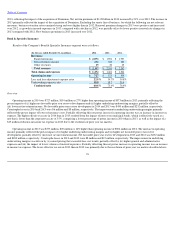
Bond & Specialty Insurance gross and net written premiums were as follows:
Gross and net written premiums in 2014 increased by 2% and 4%, respectively, over 2013. Gross and net written premiums in 2013 increased by
3% and 6%, respectively, over 2012.
95
Gross Written Premiums
(for the year ended December 31, in millions)
2014
2013
2012
Total Bond & Specialty Insurance
$
2,165
$
2,131
$
2,059
Net Written Premiums
(for the year ended December 31, in millions)
2014
2013
2012
Total Bond & Specialty Insurance
$
2,103
$
2,030
$
1,924