Travelers 2014 Annual Report Download - page 5
Download and view the complete annual report
Please find page 5 of the 2014 Travelers annual report below. You can navigate through the pages in the report by either clicking on the pages listed below, or by using the keyword search tool below to find specific information within the annual report.-
 1
1 -
 2
2 -
 3
3 -
 4
4 -
 5
5 -
 6
6 -
 7
7 -
 8
8 -
 9
9 -
 10
10 -
 11
11 -
 12
12 -
 13
13 -
 14
14 -
 15
15 -
 16
16 -
17
-
18
-
19
-
20
-
21
-
22
-
23
-
24
-
25
-
26
-
27
-
28
-
29
-
30
-
31
-
32
-
33
-
34
-
35
-
36
-
37
-
38
-
39
-
40
-
41
-
42
-
43
-
44
-
45
-
46
-
47
-
48
-
49
-
50
-
51
-
52
-
53
-
54
-
55
-
56
-
57
-
58
-
59
-
60
-
61
-
62
-
63
-
64
-
65
-
66
-
67
-
68
-
69
-
70
-
71
-
72
-
73
-
74
-
75
-
76
-
77
-
78
-
79
-
80
-
81
-
82
-
83
-
84
-
85
-
86
-
87
-
88
-
89
-
90
-
91
-
92
-
93
-
94
-
95
-
96
-
97
-
98
-
99
-
100
-
101
-
102
-
103
-
104
-
105
-
106
-
107
-
108
-
109
-
110
-
111
-
112
-
113
-
114
-
115
-
116
-
117
-
118
-
119
-
120
-
121
-
122
-
123
-
124
-
125
-
126
-
127
-
128
-
129
-
130
-
131
-
132
-
133
-
134
-
135
-
136
-
137
-
138
-
139
-
140
-
141
-
142
-
143
-
144
-
145
-
146
-
147
-
148
-
149
-
150
-
151
-
152
-
153
-
154
-
155
-
156
-
157
-
158
-
159
-
160
-
161
-
162
-
163
-
164
-
165
-
166
-
167
-
168
-
169
-
170
-
171
-
172
-
173
-
174
-
175
-
176
-
177
-
178
-
179
-
180
-
181
-
182
-
183
-
184
-
185
-
186
-
187
-
188
-
189
-
190
-
191
-
192
-
193
-
194
-
195
-
196
-
197
-
198
-
199
-
200
-
201
-
202
-
203
-
204
-
205
-
206
-
207
-
208
-
209
-
210
-
211
-
212
-
213
-
214
-
215
-
216
-
217
-
218
-
219
-
220
-
221
-
222
-
223
-
224
-
225
-
226
-
227
-
228
-
229
-
230
-
231
-
232
-
233
-
234
-
235
-
236
-
237
-
238
-
239
-
240
-
241
-
242
-
243
-
244
-
245
-
246
-
247
-
248
-
249
-
250
-
251
-
252
-
253
-
254
-
255
-
256
-
257
-
258
-
259
-
260
-
261
-
262
-
263
-
264
-
265
-
266
-
267
-
268
-
269
-
270
-
271
-
272
-
273
-
274
-
275
-
276
-
277
-
278
-
279
-
280
-
281
-
282
-
283
-
284
-
285
-
286
-
287
-
288
-
289
-
290
-
291
-
292
-
293
-
294
-
295
-
296
-
297
-
298
-
299
-
300
-
301
-
302
-
303
-
304
-
305
-
306
-
307
-
308
-
309
-
310
-
311
-
312
-
313
-
314
-
315
-
316
-
317
-
318
-
319
-
320
-
321
-
322
-
323
-
324
-
325
-
326
-
327
-
328
-
329
-
330
-
331
-
332
-
333
-
334
-
335
-
336
-
337
-
338
-
339
-
340
-
341
-
342
-
343
-
344
-
345
-
346
-
347
-
348
-
349
-
350
-
351
-
352
-
353
-
354
-
355
-
356
-
357
-
358
-
359
-
360
-
361
-
362
-
363
-
364
-
365
-
366
 |
 |

Table of Contents
dividends and share repurchases. Capital raised by debt and equity offerings may also increase statutory capital and surplus.
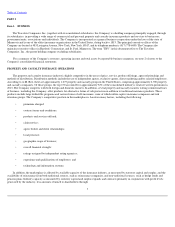
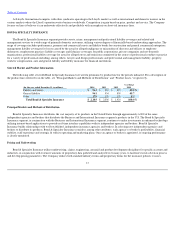
Pricing and Underwriting
Pricing of the Company's property and casualty insurance products is generally developed based upon an estimation of expected losses, the
expenses associated with producing, issuing and servicing business and managing claims, the time value of money related to the expected loss and
expense cash flows, and a reasonable allowance for profit that considers the capital needed to support the Company's business. The Company has
a disciplined approach to underwriting and risk management that emphasizes product returns and profitable growth over the long
-
term rather than
premium volume or market share. The Company's insurance subsidiaries are subject to state laws and regulations regarding rate and policy form
approvals. The applicable state laws and regulations establish standards in certain lines of business to ensure that rates are not excessive,
inadequate, unfairly discriminatory, or used to engage in unfair price competition. The Company's ability to increase rates and the relative timing of
the process are dependent upon each respective state's requirements, as well as the competitive market environment.
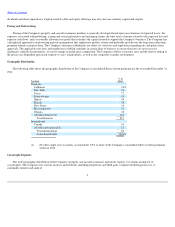
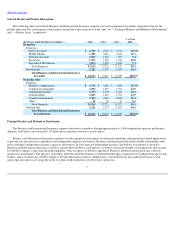
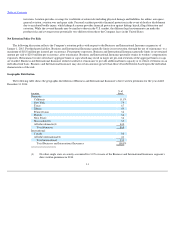
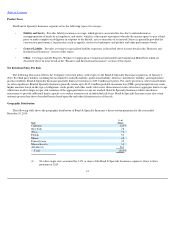
Geographic Distribution
The following table shows the geographic distribution of the Company's consolidated direct written premiums for the year ended December 31,
2014:
Catastrophe Exposure
The wide geographic distribution of the Company's property and casualty insurance operations exposes it to claims arising out of
catastrophes. The Company uses various analyses and methods, including proprietary and third
-
party computer modeling processes, to
continually monitor and analyze
4
Location
% of
Total
Domestic:
California
9.6
%
New York
9.6
Texas
7.2
Pennsylvania
4.6
Illinois
4.0
Florida
3.9
New Jersey
3.8
Massachusetts
3.1
Georgia
3.0
All other domestic(1)
42.9
Total domestic
91.7
International:
Canada
5.6
All other international(1)
2.7
Total international
8.3
Consolidated total
100.0
%
(1)
No other single state or country accounted for 3.0% or more of the Company's consolidated direct written premiums
written in 2014.