Travelers 2014 Annual Report Download - page 84
Download and view the complete annual report
Please find page 84 of the 2014 Travelers annual report below. You can navigate through the pages in the report by either clicking on the pages listed below, or by using the keyword search tool below to find specific information within the annual report.-
 1
1 -
2
-
3
-
4
-
5
-
6
-
7
-
8
-
9
-
10
-
11
-
12
-
13
-
14
-
15
-
16
-
17
-
18
-
19
-
20
-
21
-
22
-
23
-
24
-
25
-
26
-
27
-
28
-
29
-
30
-
31
-
32
-
33
-
34
-
35
-
36
-
37
-
38
-
39
-
40
-
41
-
42
-
43
-
44
-
45
-
46
-
47
-
48
-
49
-
50
-
51
-
52
-
53
-
54
-
55
-
56
-
57
-
58
-
59
-
60
-
61
-
62
-
63
-
64
-
65
-
66
-
67
-
68
-
69
-
70
-
71
-
72
-
73
-
 74
74 -
 75
75 -
 76
76 -
 77
77 -
 78
78 -
 79
79 -
 80
80 -
 81
81 -
 82
82 -
 83
83 -
 84
84 -
 85
85 -
 86
86 -
 87
87 -
 88
88 -
 89
89 -
 90
90 -
 91
91 -
 92
92 -
 93
93 -
 94
94 -
95
-
96
-
97
-
98
-
99
-
100
-
101
-
102
-
103
-
104
-
105
-
106
-
107
-
108
-
109
-
110
-
111
-
112
-
113
-
114
-
115
-
116
-
117
-
118
-
119
-
120
-
121
-
122
-
123
-
124
-
125
-
126
-
127
-
128
-
129
-
130
-
131
-
132
-
133
-
134
-
135
-
136
-
137
-
138
-
139
-
140
-
141
-
142
-
143
-
144
-
145
-
146
-
147
-
148
-
149
-
150
-
151
-
152
-
153
-
154
-
155
-
156
-
157
-
158
-
159
-
160
-
161
-
162
-
163
-
164
-
165
-
166
-
167
-
168
-
169
-
170
-
171
-
172
-
173
-
174
-
175
-
176
-
177
-
178
-
179
-
180
-
181
-
182
-
183
-
184
-
185
-
186
-
187
-
188
-
189
-
190
-
191
-
192
-
193
-
194
-
195
-
196
-
197
-
198
-
199
-
200
-
201
-
202
-
203
-
204
-
205
-
206
-
207
-
208
-
209
-
210
-
211
-
212
-
213
-
214
-
215
-
216
-
217
-
218
-
219
-
220
-
221
-
222
-
223
-
224
-
225
-
226
-
227
-
228
-
229
-
230
-
231
-
232
-
233
-
234
-
235
-
236
-
237
-
238
-
239
-
240
-
241
-
242
-
243
-
244
-
245
-
246
-
247
-
248
-
249
-
250
-
251
-
252
-
253
-
254
-
255
-
256
-
257
-
258
-
259
-
260
-
261
-
262
-
263
-
264
-
265
-
266
-
267
-
268
-
269
-
270
-
271
-
272
-
273
-
274
-
275
-
276
-
277
-
278
-
279
-
280
-
281
-
282
-
283
-
284
-
285
-
286
-
287
-
288
-
289
-
290
-
291
-
292
-
293
-
294
-
295
-
296
-
297
-
298
-
299
-
300
-
301
-
302
-
303
-
304
-
305
-
306
-
307
-
308
-
309
-
310
-
311
-
312
-
313
-
314
-
315
-
316
-
317
-
318
-
319
-
320
-
321
-
322
-
323
-
324
-
325
-
326
-
327
-
328
-
329
-
330
-
331
-
332
-
333
-
334
-
335
-
336
-
337
-
338
-
339
-
340
-
341
-
342
-
343
-
344
-
345
-
346
-
347
-
348
-
349
-
350
-
351
-
352
-
353
-
354
-
355
-
356
-
357
-
358
-
359
-
360
-
361
-
362
-
363
-
364
-
365
-
366
 |
 |

Table of Contents
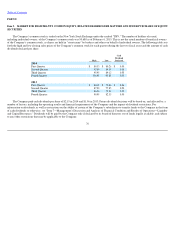
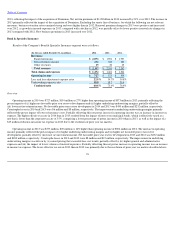
Net Investment Income
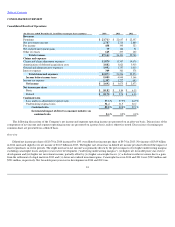
The following table sets forth information regarding the Company's investments.
Net investment income in 2014 was $2.79 billion, $71 million or 3% higher than in 2013. Net investment income from fixed maturity investments
in 2014 was $2.24 billion, $66 million lower than in 2013, primarily resulting from lower long
-
term reinvestment yields available in the market, partially
offset by the impact of the acquisition of Dominion. Net investment income generated by non
-
fixed maturity investments in 2014 was $573 million,
$141 million higher than in 2013, primarily driven by higher returns from the Company's private equity investments, as well as higher returns from
real estate partnership investments.
Net investment income in 2013 was $2.72 billion, $173 million or 6% lower than in 2012. Net investment income from fixed maturity investments
in 2013 was $2.31 billion, $129 million lower than in 2012, primarily resulting from lower long
-
term reinvestment yields available in the market. Net
investment income generated by non
-
fixed maturity investments in 2013 was $432 million, $44 million lower than in 2012, primarily driven by lower
returns from the Company's real estate partnership investments.
Fee Income
The National Accounts market in the Business and International Insurance segment is the primary source of the Company's fee
-
based
business. The $43 million and $72 million increases in fee income in 2014 and 2013, respectively, compared with the respective prior years are
described in the Business and International Insurance segment discussion that follows.
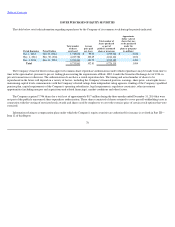
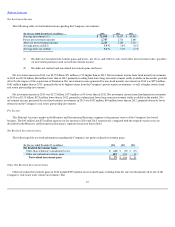
Net Realized Investment Gains
The following table sets forth information regarding the Company's net pretax realized investment gains.
Other Net Realized Investment Gains
Other net realized investment gains in 2014 included $35 million of net realized gains resulting from the sale of substantially all of one of the
Company's real estate joint venture investments. The
83
(for the year ended December 31, in millions)
2014
2013
2012
Average investments(1)
$
72,049
$
70,697
$
69,863
Pretax net investment income
2,787
2,716
2,889
After
-
tax net investment income
2,216
2,186
2,316
Average pretax yield(2)
3.9
%
3.8
%
4.1
%
Average after
-
tax yield(2)
3.1
%
3.1
%
3.3
%
(1)
Excludes net unrealized investment gains and losses, net of tax, and reflects cash, receivables for investment sales, payables
on investment purchases and accrued investment income.
(2)
Excludes net realized and unrealized investment gains and losses.
(for the year ended December 31, in millions)
2014
2013
2012
Net Realized Investment Gains
Other
-
than
-
temporary impairment losses
$
(26
)
$
(15
)
$
(15
)
Other net realized investment gains
105
181
66
Net realized investment gains
$
79
$
166
$
51