Travelers 2014 Annual Report Download - page 186
Download and view the complete annual report
Please find page 186 of the 2014 Travelers annual report below. You can navigate through the pages in the report by either clicking on the pages listed below, or by using the keyword search tool below to find specific information within the annual report.-
 1
1 -
2
-
3
-
4
-
5
-
6
-
7
-
8
-
9
-
10
-
11
-
12
-
13
-
14
-
15
-
16
-
17
-
18
-
19
-
20
-
21
-
22
-
23
-
24
-
25
-
26
-
27
-
28
-
29
-
30
-
31
-
32
-
33
-
34
-
35
-
36
-
37
-
38
-
39
-
40
-
41
-
42
-
43
-
44
-
45
-
46
-
47
-
48
-
49
-
50
-
51
-
52
-
53
-
54
-
55
-
56
-
57
-
58
-
59
-
60
-
61
-
62
-
63
-
64
-
65
-
66
-
67
-
68
-
69
-
70
-
71
-
72
-
73
-
74
-
75
-
76
-
77
-
78
-
79
-
80
-
81
-
82
-
83
-
84
-
85
-
86
-
87
-
88
-
89
-
90
-
91
-
92
-
93
-
94
-
95
-
96
-
97
-
98
-
99
-
100
-
101
-
102
-
103
-
104
-
105
-
106
-
107
-
108
-
109
-
110
-
111
-
112
-
113
-
114
-
115
-
116
-
117
-
118
-
119
-
120
-
121
-
122
-
123
-
124
-
125
-
126
-
127
-
128
-
129
-
130
-
131
-
132
-
133
-
134
-
135
-
136
-
137
-
138
-
139
-
140
-
141
-
142
-
143
-
144
-
145
-
146
-
147
-
148
-
149
-
150
-
151
-
152
-
153
-
154
-
155
-
156
-
157
-
158
-
159
-
160
-
161
-
162
-
163
-
164
-
165
-
166
-
167
-
168
-
169
-
170
-
171
-
172
-
173
-
174
-
175
-
 176
176 -
 177
177 -
 178
178 -
 179
179 -
 180
180 -
 181
181 -
 182
182 -
 183
183 -
 184
184 -
 185
185 -
 186
186 -
 187
187 -
 188
188 -
 189
189 -
 190
190 -
 191
191 -
 192
192 -
 193
193 -
 194
194 -
 195
195 -
 196
196 -
197
-
198
-
199
-
200
-
201
-
202
-
203
-
204
-
205
-
206
-
207
-
208
-
209
-
210
-
211
-
212
-
213
-
214
-
215
-
216
-
217
-
218
-
219
-
220
-
221
-
222
-
223
-
224
-
225
-
226
-
227
-
228
-
229
-
230
-
231
-
232
-
233
-
234
-
235
-
236
-
237
-
238
-
239
-
240
-
241
-
242
-
243
-
244
-
245
-
246
-
247
-
248
-
249
-
250
-
251
-
252
-
253
-
254
-
255
-
256
-
257
-
258
-
259
-
260
-
261
-
262
-
263
-
264
-
265
-
266
-
267
-
268
-
269
-
270
-
271
-
272
-
273
-
274
-
275
-
276
-
277
-
278
-
279
-
280
-
281
-
282
-
283
-
284
-
285
-
286
-
287
-
288
-
289
-
290
-
291
-
292
-
293
-
294
-
295
-
296
-
297
-
298
-
299
-
300
-
301
-
302
-
303
-
304
-
305
-
306
-
307
-
308
-
309
-
310
-
311
-
312
-
313
-
314
-
315
-
316
-
317
-
318
-
319
-
320
-
321
-
322
-
323
-
324
-
325
-
326
-
327
-
328
-
329
-
330
-
331
-
332
-
333
-
334
-
335
-
336
-
337
-
338
-
339
-
340
-
341
-
342
-
343
-
344
-
345
-
346
-
347
-
348
-
349
-
350
-
351
-
352
-
353
-
354
-
355
-
356
-
357
-
358
-
359
-
360
-
361
-
362
-
363
-
364
-
365
-
366
 |
 |

Table of Contents
THE TRAVELERS COMPANIES, INC. AND SUBSIDIARIES
NOTES TO CONSOLIDATED FINANCIAL STATEMENTS (Continued)
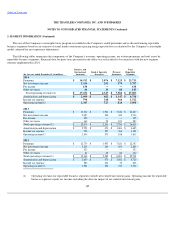
2. SEGMENT INFORMATION (Continued)
The cost of the Company's catastrophe treaty program is included in the Company's ceded premiums and is allocated among reportable
business segments based on an estimate of actual market reinsurance pricing using expected losses calculated by the Company's catastrophe
model, adjusted for any experience adjustments.
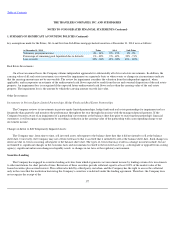
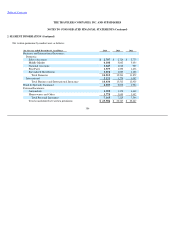
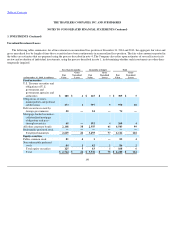
The following tables summarize the components of the Company's revenues, operating income, net written premiums and total assets by
reportable business segments. Financial data for prior years presented in the tables was reclassified to be consistent with the new segment
structure implemented in 2014.
185
(for the year ended December 31, in millions)
Business and
International
Insurance
Bond & Specialty
Insurance
Personal
Insurance
Total
Reportable
Segments
2014
Premiums
$
14,512
$
2,076
$
7,125
$
23,713
Net investment income
2,156
252
379
2,787
Fee income
438
—
—
438
Other revenues
46
19
80
145
Total operating revenues(1)
$
17,152
$
2,347
$
7,584
$
27,083
Amortization and depreciation
$
2,909
$
482
$
1,347
$
4,738
Income tax expense
798
348
366
1,512
Operating income(1)
2,347
727
824
3,898
2013
Premiums
$
13,332
$
1,981
$
7,324
$
22,637
Net investment income
2,087
260
369
2,716
Fee income
395
—
—
395
Other revenues
160
20
103
283
Total operating revenues(1)
$
15,974
$
2,261
$
7,796
$
26,031
Amortization and depreciation
$
2,751
$
473
$
1,461
$
4,685
Income tax expense
758
227
366
1,351
Operating income(1)
2,404
573
838
3,815
2012
Premiums
$
12,779
$
1,957
$
7,621
$
22,357
Net investment income
2,205
280
404
2,889
Fee income
323
—
—
323
Other revenues
41
25
66
132
Total operating revenues(1)
$
15,348
$
2,262
$
8,091
$
25,701
Amortization and depreciation
$
2,654
$
470
$
1,602
$
4,726
Income tax expense
580
214
32
826
Operating income(1)
1,981
504
217
2,702
(1)
Operating revenues for reportable business segments exclude net realized investment gains. Operating income for reportable
business segments equals net income excluding the after
-
tax impact of net realized investment gains.