Travelers 2014 Annual Report Download - page 110
Download and view the complete annual report
Please find page 110 of the 2014 Travelers annual report below. You can navigate through the pages in the report by either clicking on the pages listed below, or by using the keyword search tool below to find specific information within the annual report.-
 1
1 -
2
-
3
-
4
-
5
-
6
-
7
-
8
-
9
-
10
-
11
-
12
-
13
-
14
-
15
-
16
-
17
-
18
-
19
-
20
-
21
-
22
-
23
-
24
-
25
-
26
-
27
-
28
-
29
-
30
-
31
-
32
-
33
-
34
-
35
-
36
-
37
-
38
-
39
-
40
-
41
-
42
-
43
-
44
-
45
-
46
-
47
-
48
-
49
-
50
-
51
-
52
-
53
-
54
-
55
-
56
-
57
-
58
-
59
-
60
-
61
-
62
-
63
-
64
-
65
-
66
-
67
-
68
-
69
-
70
-
71
-
72
-
73
-
74
-
75
-
76
-
77
-
78
-
79
-
80
-
81
-
82
-
83
-
84
-
85
-
86
-
87
-
88
-
89
-
90
-
91
-
92
-
93
-
94
-
95
-
96
-
97
-
98
-
99
-
 100
100 -
 101
101 -
 102
102 -
 103
103 -
 104
104 -
 105
105 -
 106
106 -
 107
107 -
 108
108 -
 109
109 -
 110
110 -
 111
111 -
 112
112 -
 113
113 -
 114
114 -
 115
115 -
 116
116 -
 117
117 -
 118
118 -
 119
119 -
 120
120 -
121
-
122
-
123
-
124
-
125
-
126
-
127
-
128
-
129
-
130
-
131
-
132
-
133
-
134
-
135
-
136
-
137
-
138
-
139
-
140
-
141
-
142
-
143
-
144
-
145
-
146
-
147
-
148
-
149
-
150
-
151
-
152
-
153
-
154
-
155
-
156
-
157
-
158
-
159
-
160
-
161
-
162
-
163
-
164
-
165
-
166
-
167
-
168
-
169
-
170
-
171
-
172
-
173
-
174
-
175
-
176
-
177
-
178
-
179
-
180
-
181
-
182
-
183
-
184
-
185
-
186
-
187
-
188
-
189
-
190
-
191
-
192
-
193
-
194
-
195
-
196
-
197
-
198
-
199
-
200
-
201
-
202
-
203
-
204
-
205
-
206
-
207
-
208
-
209
-
210
-
211
-
212
-
213
-
214
-
215
-
216
-
217
-
218
-
219
-
220
-
221
-
222
-
223
-
224
-
225
-
226
-
227
-
228
-
229
-
230
-
231
-
232
-
233
-
234
-
235
-
236
-
237
-
238
-
239
-
240
-
241
-
242
-
243
-
244
-
245
-
246
-
247
-
248
-
249
-
250
-
251
-
252
-
253
-
254
-
255
-
256
-
257
-
258
-
259
-
260
-
261
-
262
-
263
-
264
-
265
-
266
-
267
-
268
-
269
-
270
-
271
-
272
-
273
-
274
-
275
-
276
-
277
-
278
-
279
-
280
-
281
-
282
-
283
-
284
-
285
-
286
-
287
-
288
-
289
-
290
-
291
-
292
-
293
-
294
-
295
-
296
-
297
-
298
-
299
-
300
-
301
-
302
-
303
-
304
-
305
-
306
-
307
-
308
-
309
-
310
-
311
-
312
-
313
-
314
-
315
-
316
-
317
-
318
-
319
-
320
-
321
-
322
-
323
-
324
-
325
-
326
-
327
-
328
-
329
-
330
-
331
-
332
-
333
-
334
-
335
-
336
-
337
-
338
-
339
-
340
-
341
-
342
-
343
-
344
-
345
-
346
-
347
-
348
-
349
-
350
-
351
-
352
-
353
-
354
-
355
-
356
-
357
-
358
-
359
-
360
-
361
-
362
-
363
-
364
-
365
-
366
 |
 |

Table of Contents
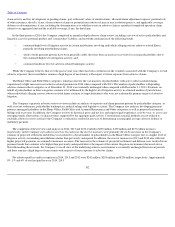
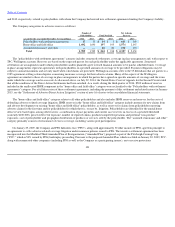
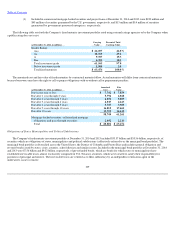
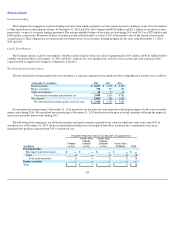
The following table sets forth the Company's fixed maturity investment portfolio rated using external ratings agencies or by the Company when
a public rating does not exist:
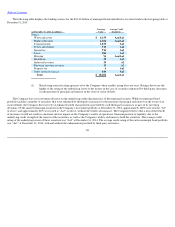
The amortized cost and fair value of fixed maturities by contractual maturity follow. Actual maturities will differ from contractual maturities
because borrowers may have the right to call or prepay obligations with or without call or prepayment penalties.
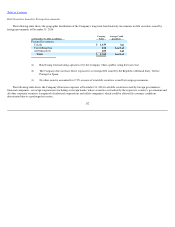
Obligations of States, Municipalities and Political Subdivisions
The Company's fixed maturity investment portfolio at December 31, 2014 and 2013 included $33.57 billion and $35.56 billion, respectively, of
securities which are obligations of states, municipalities and political subdivisions (collectively referred to as the municipal bond portfolio). The
municipal bond portfolio is diversified across the United States, the District of Columbia and Puerto Rico and includes general obligation and
revenue bonds issued by states, cities, counties, school districts and similar issuers. Included in the municipal bond portfolio at December 31, 2014
and 2013 were $7.56 billion and $9.52 billion, respectively, of pre
-
refunded bonds, which are bonds for which states or municipalities have
established irrevocable trusts, almost exclusively comprised of U.S. Treasury securities, which were created to satisfy their responsibility for
payments of principal and interest. The irrevocable trusts are verified as to their sufficiency by an independent verification agent of the
underwriter, issuer or trustee.
109
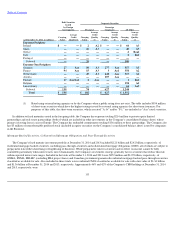
(3)
Included in commercial mortgage
-
backed securities and project loans at December 31, 2014 and 2013 were $189 million and
$45 million of securities guaranteed by the U.S. government, respectively, and $13 million and $14 million of securities
guaranteed by government sponsored enterprises, respectively.
(at December 31, 2014, in millions)
Carrying
Value
Percent of Total
Carrying Value
Quality Rating:
Aaa
$
26,697
42.0
%
Aa
18,769
29.6
A
9,707
15.3
Baa
6,392
10.1
Total investment grade
61,565
97.0
Below investment grade
1,909
3.0
Total fixed maturities
$
63,474
100.0
%
(at December 31, 2014, in millions)
Amortized
Cost
Fair
Value
Due in one year or less
$
7,762
$
7,859
Due after 1 year through 2 years
5,792
6,028
Due after 2 years through 3 years
4,851
5,089
Due after 3 years through 4 years
4,017
4,223
Due after 4 years through 5 years
3,787
3,985
Due after 5 years through 10 years
16,815
17,462
Due after 10 years
15,725
16,615
58,749
61,261
Mortgage
-
backed securities, collateralized mortgage
obligations and pass
-
through securities
2,052
2,213
Total
$
60,801
$
63,474